Performing a Test
50 EasyOne Pro™ / EasyOne Pro™ LAB
When three acceptable tests have been performed, the message Session
complete! appears and a quality grade from A (optimal) to F a is displayed.
Note
If FEV6 is selected (instead of FVC), the measurement will
stop automatically after 6 seconds.
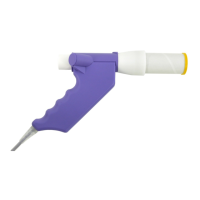
%Pred Graph
The %Pred graph is a three-segment bar. The left segment a indicates a
value below the lower limit of normal, the middle segment b represents a
value between the lower limit and the predicted value and the right seg-
ment c indicates a value above the predicted value. FVC, FEV1 and FEV1/
FVC are displayed in color, all other parameters are grey.
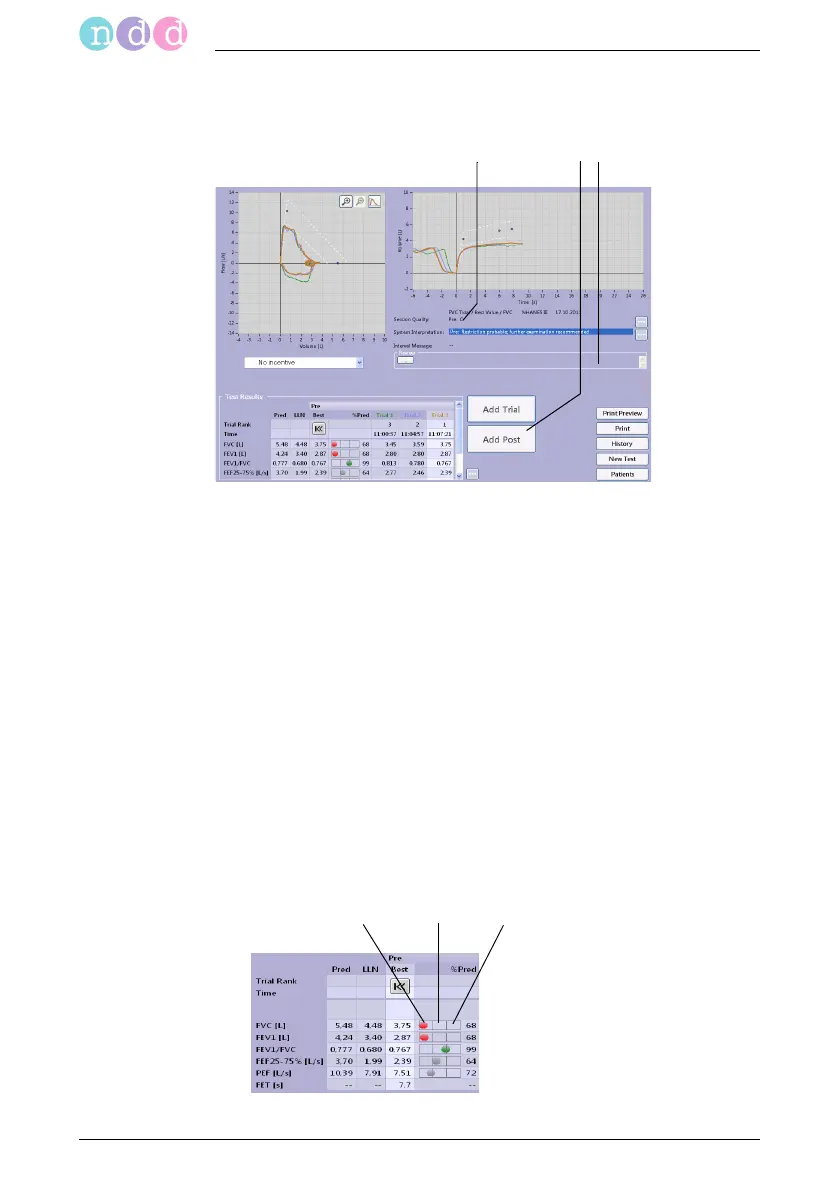
Fig. 3-11 Acquisition screen after three acceptable, expiratory FVC tests
a Quality grade
b Click to perform a post-trial (see "Bron-
chodilation (Post-Tests)" on page 53)
c Area for review comments
Fig. 3-12 %Pred graph