Chapter 8: Hardware Installation for Synchronous Mirroring 215
Line Capacities
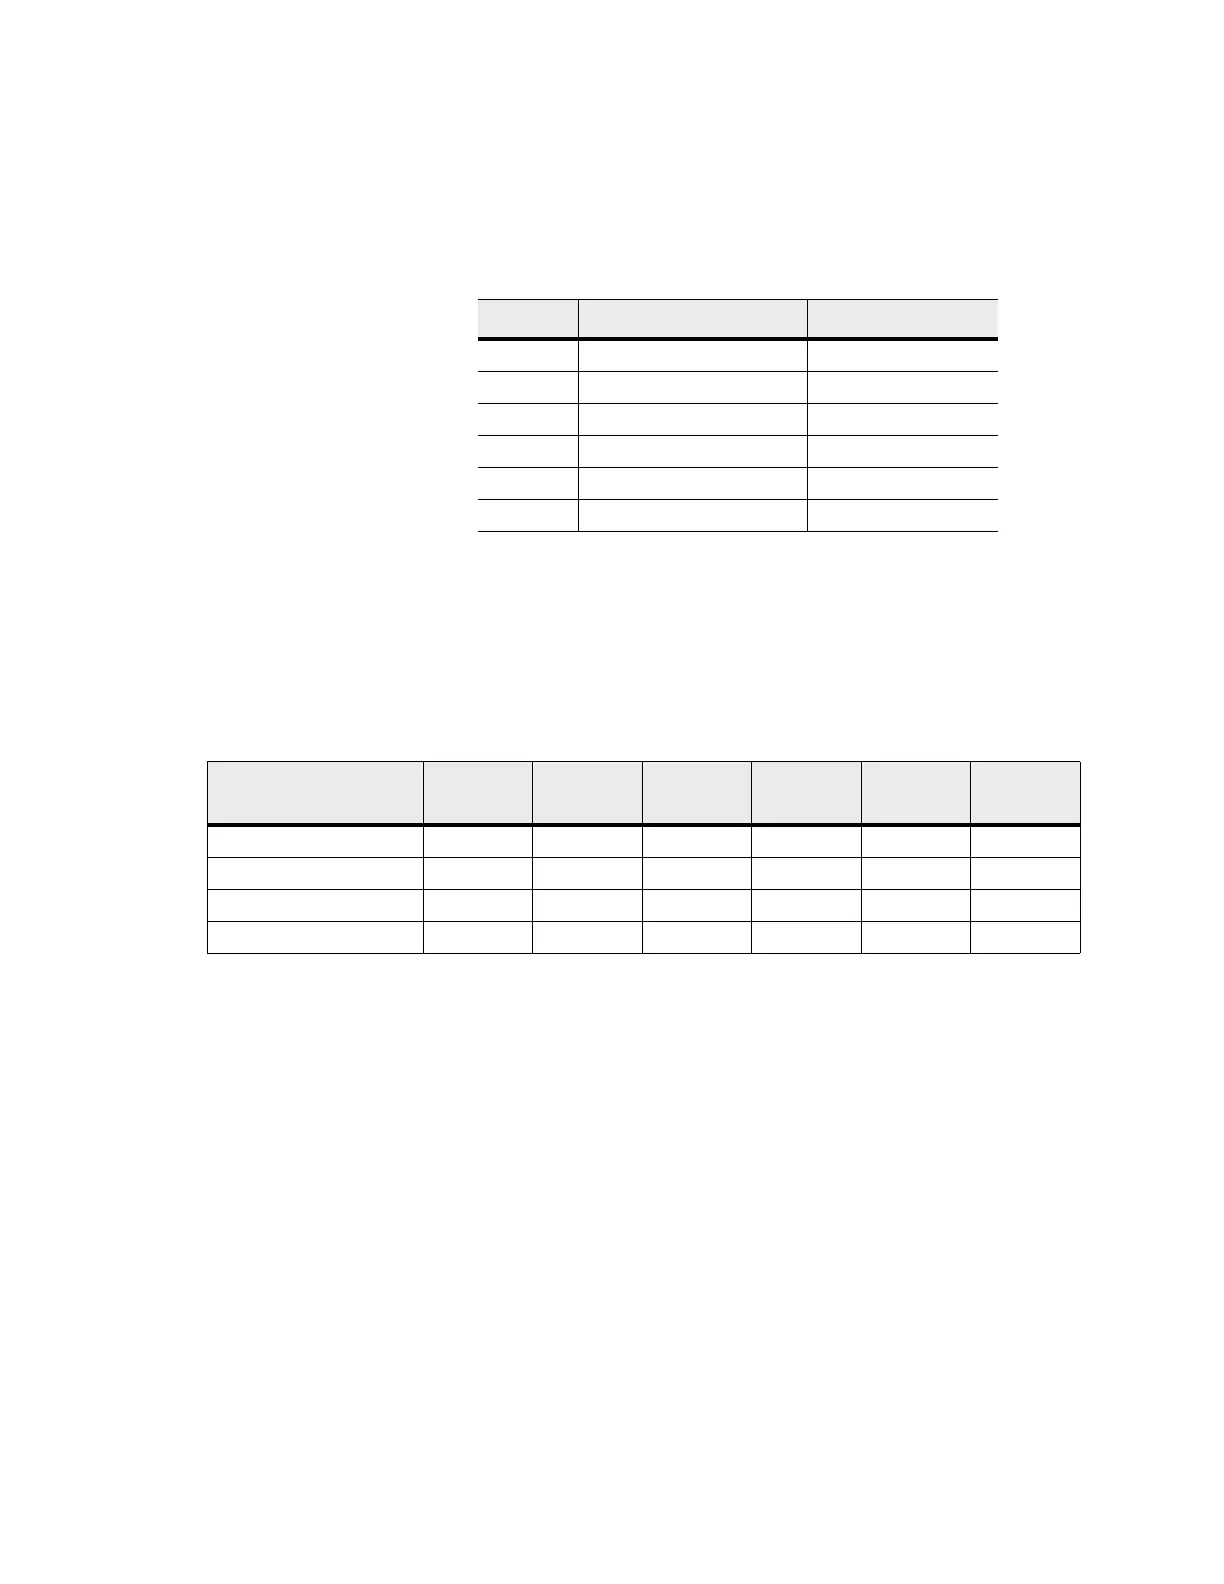
Table 2 Line Capacities and Line Speeds
The following table shows average write operations in Mb/s with corresponding line
capacity calculations. When the line capacity calculation is below 50 percent, the
result is an adequate response-time performance and a limited need for delta logging
(when the mirror lags behind the data). When the line capacity calculation is above 50
percent, the mirror can never catch up. Any transfers above 50 percent will start to
lag.
Table 3 Line Capacity Calculation for Various Write I/O Rates
Line Type Capacity in Mb/s Speed in MB/s
T-1 1.544 0.193
T-3 43.232 5.404
OC-3 155.6352 19.454
OC-12 622.5408 77.8176
OC-48 2490.1632 311.27
OC-192 9960.6528 1245.085
Average Write Time in
Mb/s
T-1 T-3 OC-3 OC-12 OC-18 OC-192
0.01 5.2% 0.2% 0.1% 0.0% 0.0% 0.0%
0.1 51.8% 1.9% 0.5% 0.1% 0.0% 0.0%
1 518.1% 18.5% 5.1% 1.3% 0.3% 0.1%
10 5181.3% 185.3% 51.4% 12.9% 3.2% 0.8%