130
Bar Graphs
Section 4-5
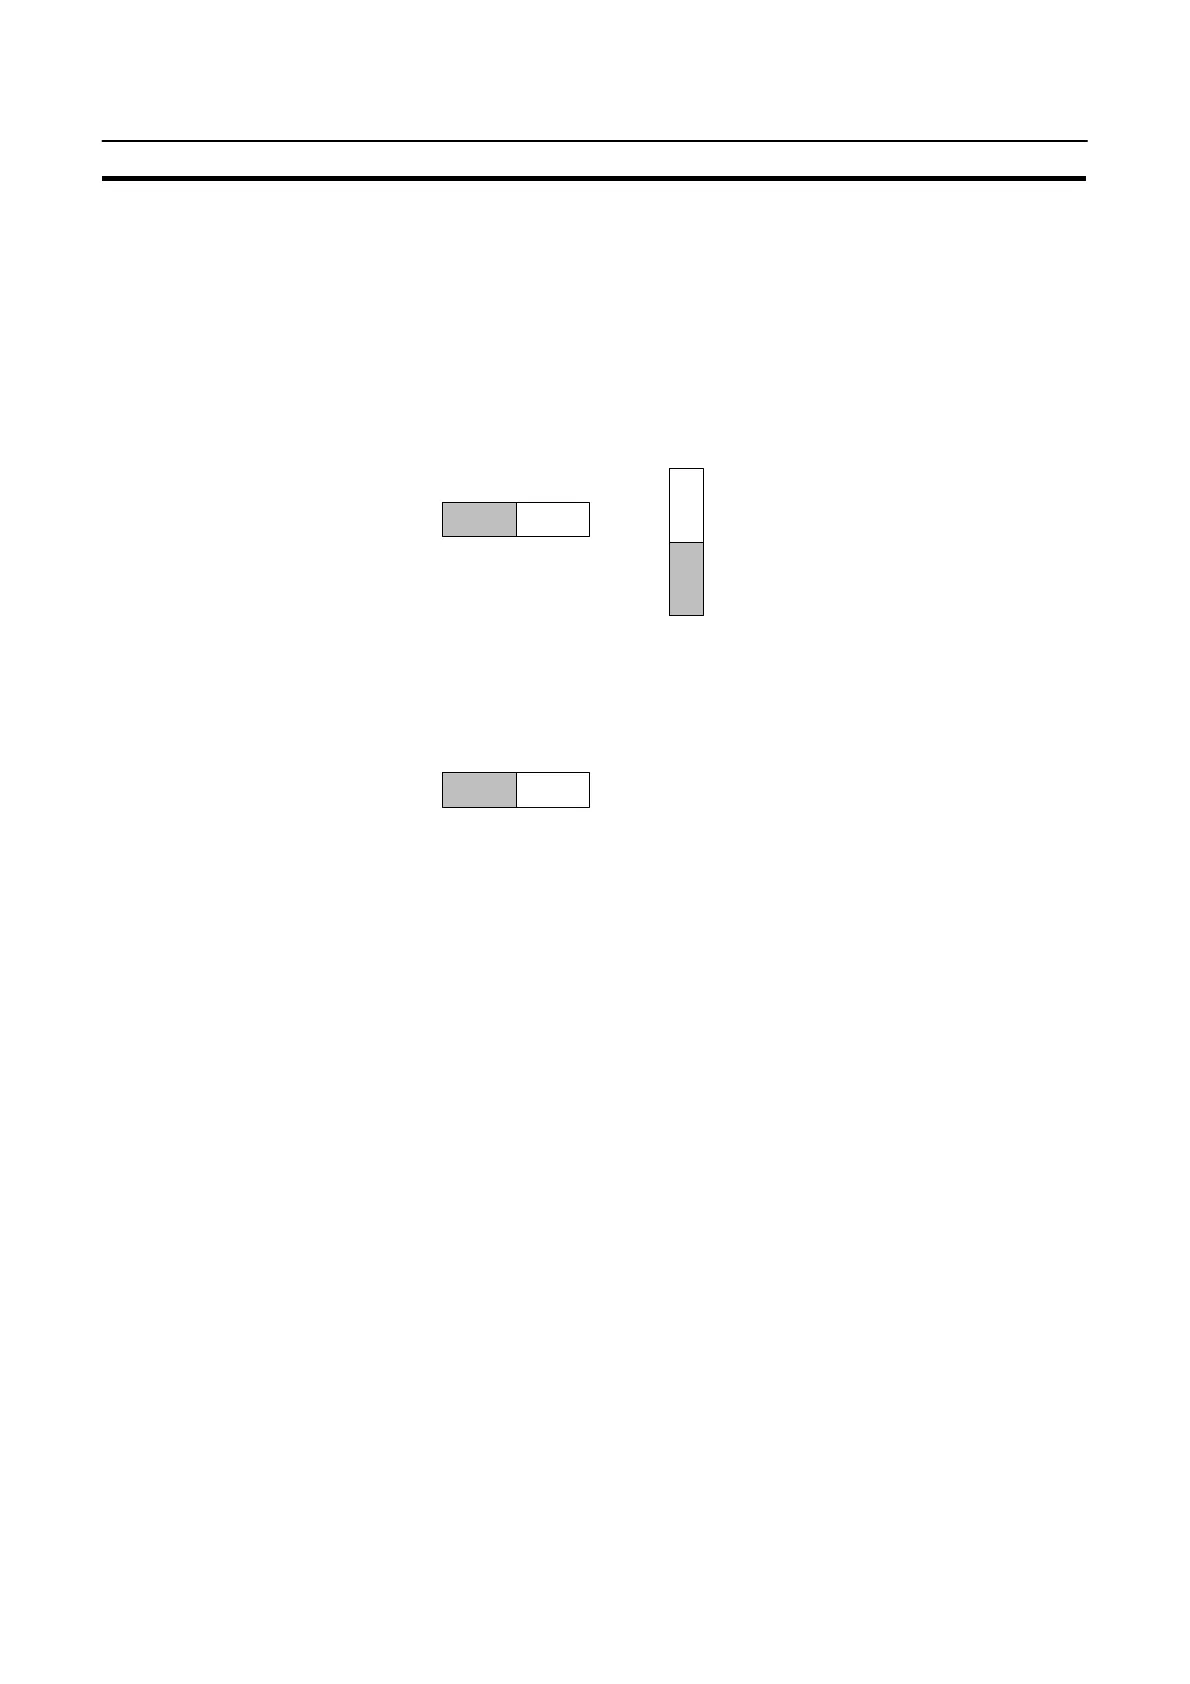
S Orientation and incremental direction
The orientation and incremental direction of the bar graph can be selected from
those mentioned below.
↑ (up): The bar graph increments upward in the vertical orientation.
↓ (down):The bar graph increments downward in the vertical orientation.
← (left): The bar graph increments to the left in the horizontal orientation.
→ (right):The bar graph increments to the right in the horizontal orientation.
Direction: →
Direction: ↑
S Graph frame
Select whether or not the graph frame (boundary line of a graph display area)
which indicates the effective display range is displayed.
← This frame is not displayed if
“Graph frame: No” has been set.
S Setting the 100 % value and % display
Set a value which corresponds to 100 % for the “100 % value”. The available
value range is “0 to 99999999” (max. eight digits). For the “% display”, whether
or not the proportion (percentage) of the reference numeral memory table value
to the “100 % value” is displayed in a numeral can be selected. The display value
is calculated as follows:
“% display” value = Numeral memory table value B “100 % value” x 100
For the font and attributes used for the numeral display, refer to “Numerals which
can be displayed” (page 127).
S Sign display and display method
Select whether or not the bar graph which indicates a value below 0 % is dis-
played.