You can also configure a notification alarm, see "Enabling/Disabling the BroadShield Ser-
vice" on page165.
BroadShield Web UIMonitoring
The BroadShield Web UI will also display real time signal status information, or a map status.
Note: If at any time you receive an error message Failed to connect to the
unit, the VersaSync Web UImay have timed out (see "Web UI Timeout" on
page227). Refresh your browser page to log back in.
To open the BroadShield user interface:
1.
Navigate to MANAGEMENT > Broadshield.
2.
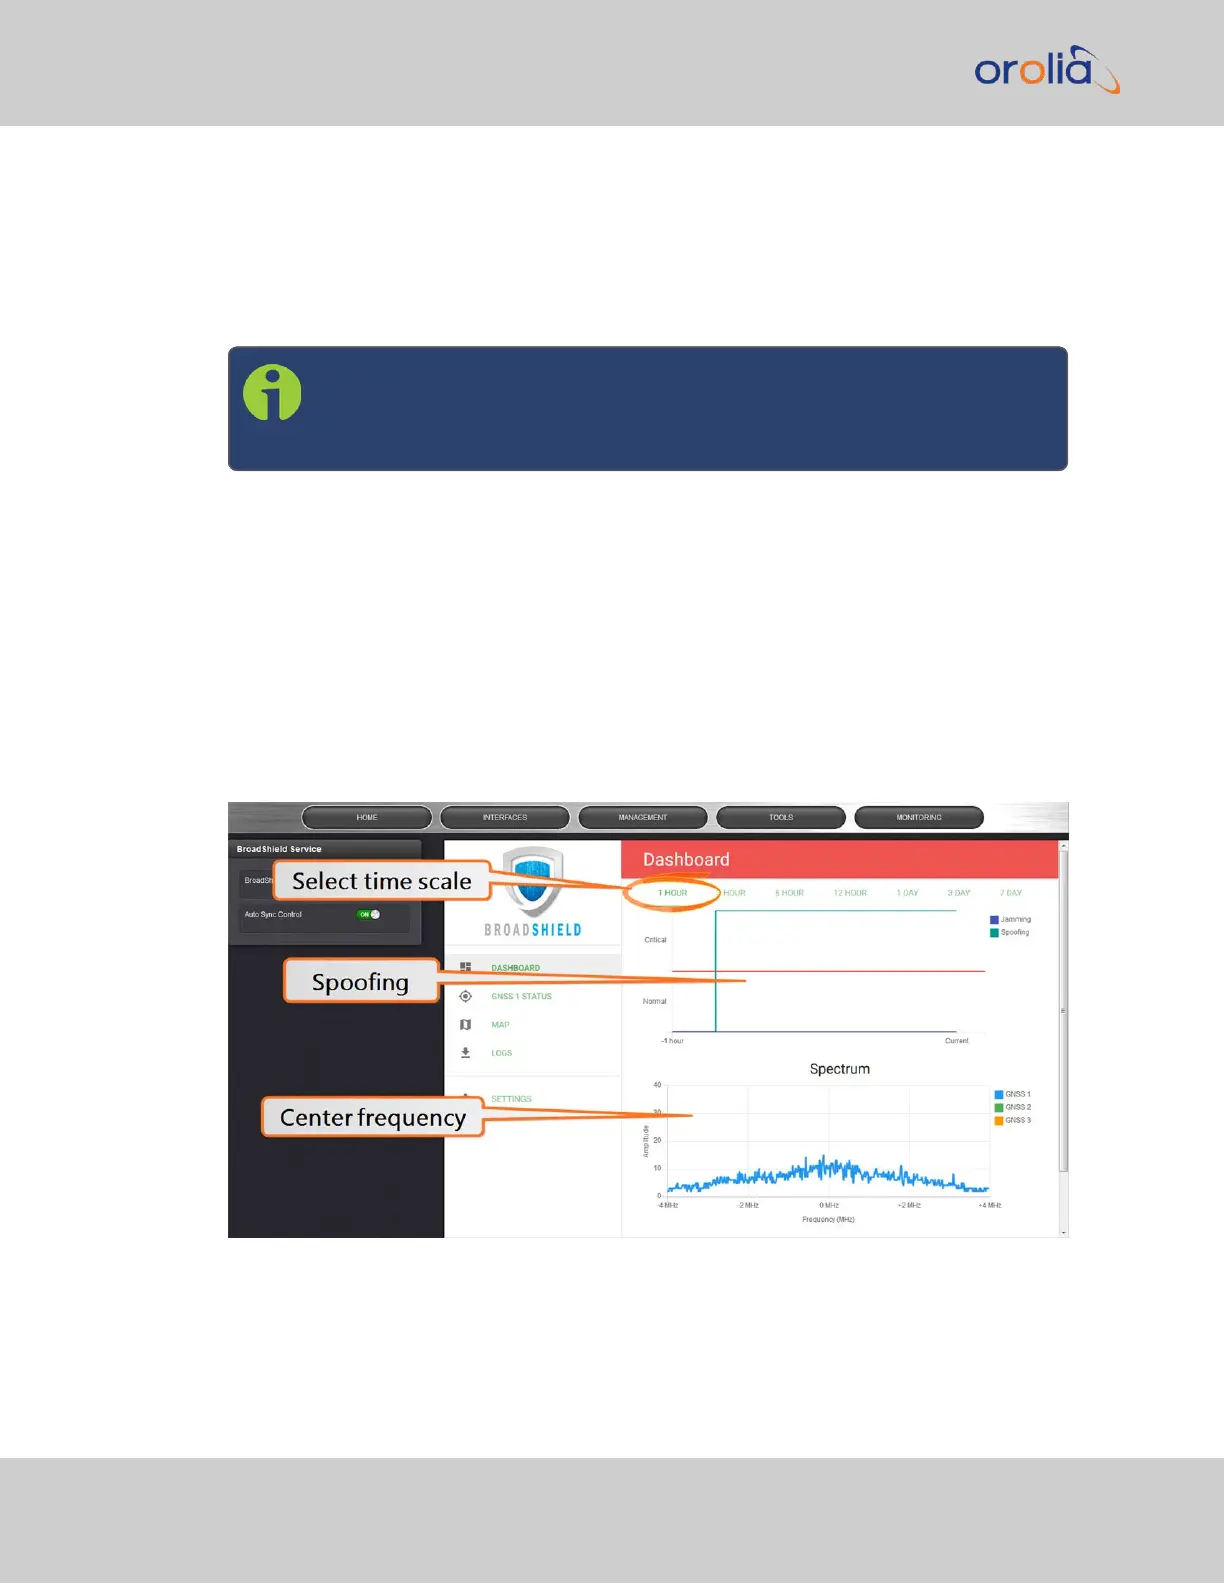
The embedded Broadshield Web UI will open, displaying the Dashboard and provid-
ing access to the following panels:
DASHBOARD
The Dashboard panel displays up to 7 days of history data, and a real-time amplitude fre-
quency spectrum. The headline background color indicates the current jamming/spoofing
status: red= jamming or spoofing detected; green = no alarms at this time
Top graph
The Dashboard top graph displays the past signal level over time, divided into a Normal
and a Critical signal level (separated by a red line). A blue line in the Critical zone indicates
168
CHAPTER 3 • VersaSync User Manual Rev. 7.0
3.3 Managing References