50 . Lambda XLS/XLS+ User's Guide
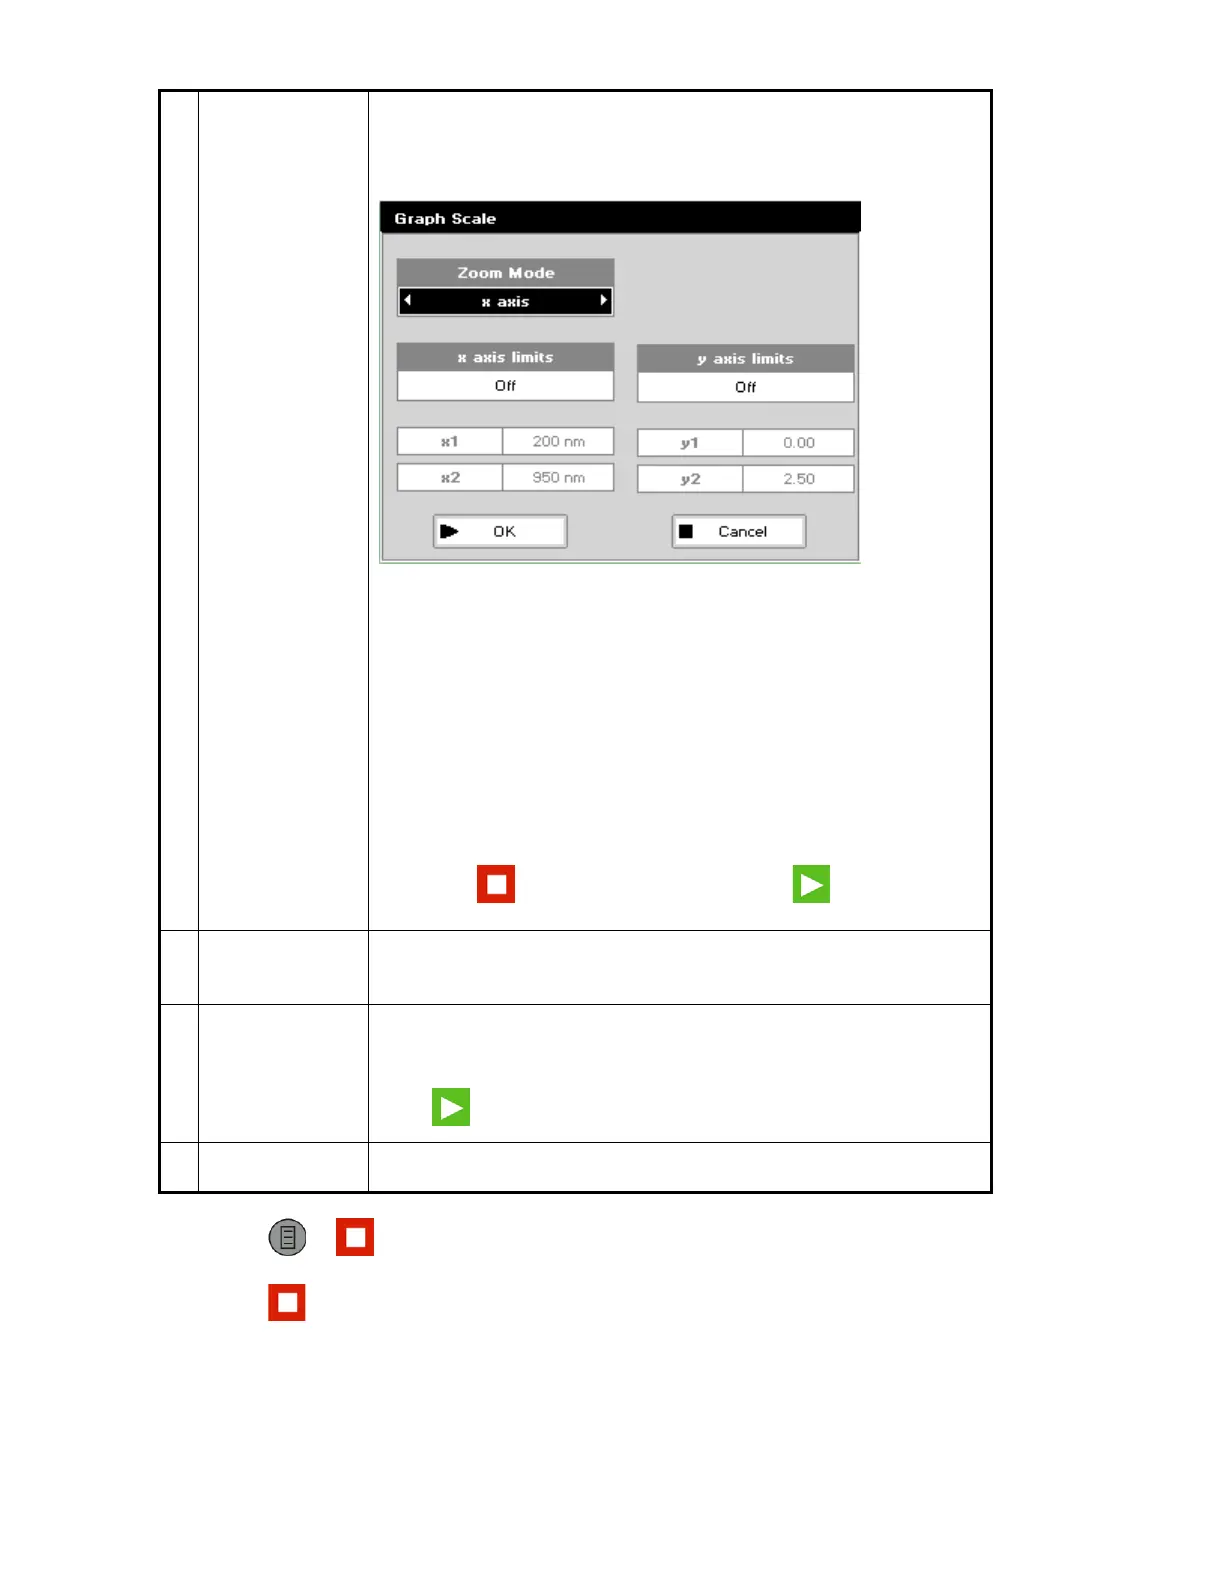
6 Graph Scale Displays the Graph Scale settings screen. This enables you to set
up a defined graph by defining the limits in either or both of the
x
and
y
axes.
Zoom Mode: This sets up the operation of the Zoom keys (up and
down arrows). The mode x axis zooms the display around the
cursor point x axis, the mode y axis zooms the display around the
cursor point y axis, and x & y axes expands both axes about the
cursor point. With
x
or
y
axis limits set to On, zooming out will only
be permitted within the set limits.
x axis limits/y axis limits: Setting to On activates the start and
finish points of the desired graph to user-defined, specific
wavelengths and/or absorbance values.
Press
to cancel the selections; press to accept them
and display the required graph.
7 Sample Number Adds a prefix to the sample number and resets the incrementing
number to the desired value.
8 Save Method Use the left and right arrows to select the folder you want to store
the method in (Favorites/Methods 1–9/SD Memory Card), then
press the down arrow and enter a name for the method. Press
Save
to save the method.
9 Auto-print Toggles Auto-Print on and off.
Press or , or wait 20 seconds to exit the method options.
Press
to return to the Standard Methods folder after all your samples have been
measured.