Getting Started with Spectrum Software . 51
The Spectrum Workspace
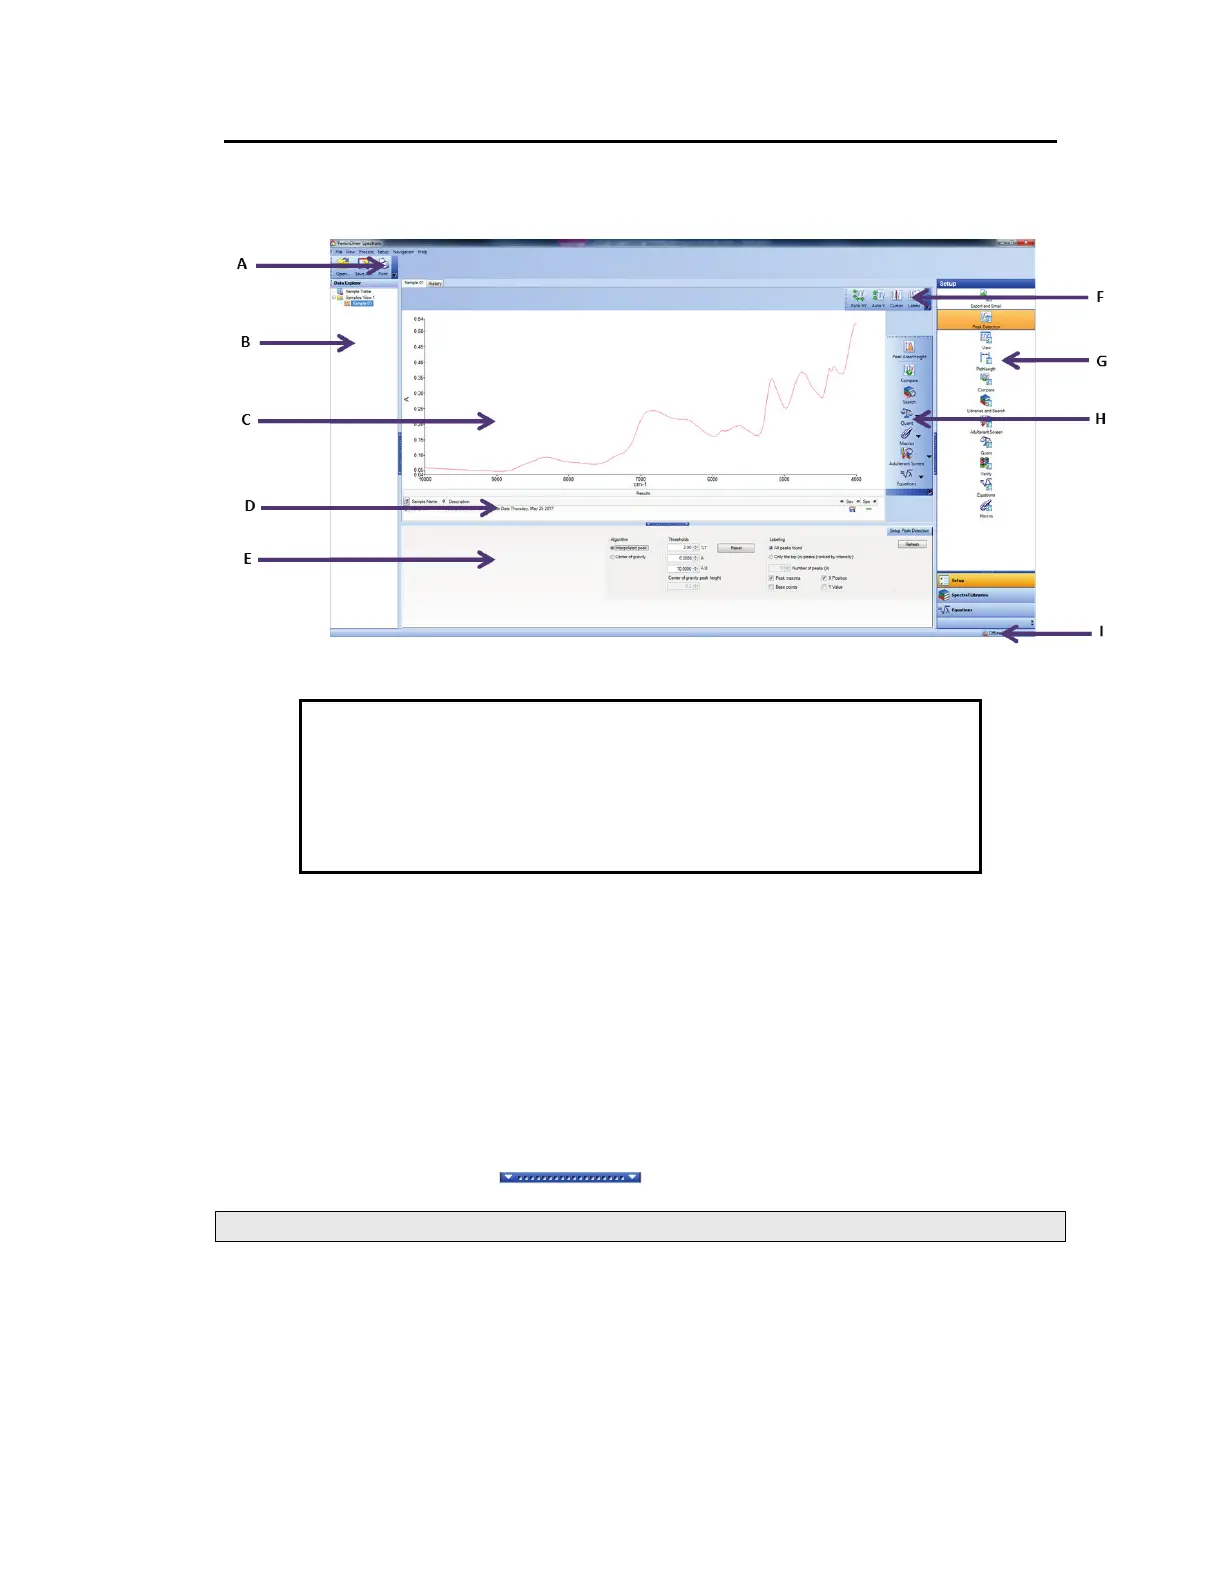
The Spectrum window, with the default layout for a Spectrum Two N installation, is shown in
Figure 29.
Figure 29 Spectrum window
A Global Toolbars F Graph Bar
B Data Explorer G Navigation Pane
C Viewing Area H Process Bar
D Information Pane I Status Bar
E Dialog Pane
The window is divided into four panes:
• The Viewing Area (C), in the center, where spectra or results are displayed.
• The Data Explorer (B), on the left, which you use to manage your spectra.
• The Navigation Pane (F), on the right, which contains shortcuts.
• The Dialog Pane (E), at the bottom, which you use to adjust parameters or enter
information when, for example, setting up your instrument.
To open or close a pane, click .
NOTE: You can also click and drag the edge of a pane to resize it.
Viewing Area
The Viewing Area (C) is a tabbed display. The tabs displayed depend on whether you have
an individual spectrum displayed, or whether you have selected a folder of spectra, known as
a Samples View, in the Data Explorer. Tabs may be added that show the results of some
processes, such as Compare, Search and Quant.
During scanning, the Live tab – which shows the spectrum in real time – may be displayed.
 Loading...