Getting Started with Spectrum Software . 61
You can also correct for baseline slope in your spectra. In Spectrum you can do this in two
ways: using an automatic baseline correction, or using an interactive baseline correction
(i-baseline) that enables you to define base points for the conversion (Figure 38).
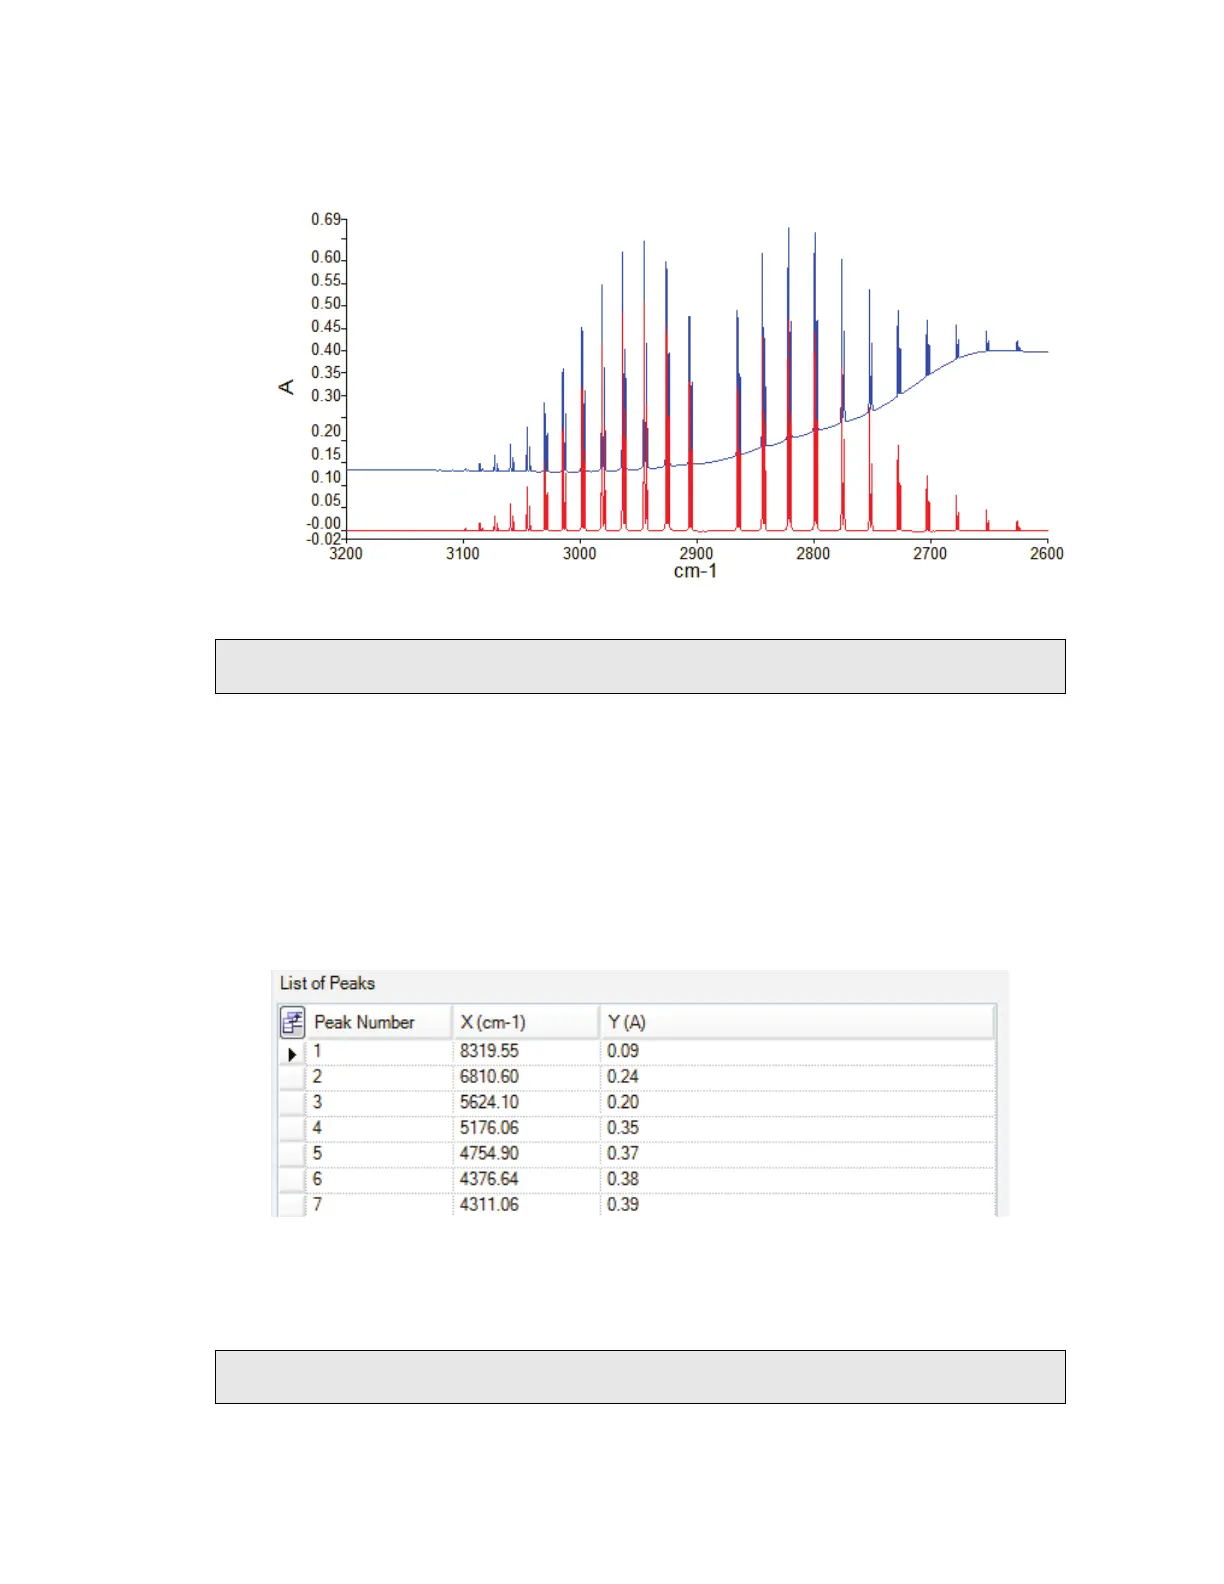
Figure 40 Spectrum with baseline corrected using i-baseline
NOTE: The Processing Your Data tutorial includes a description of ordinate-unit
conversion, automatic baseline correction, and peak detection and labeling.
Identification
Several processes in Spectrum can be used to help identify your sample.
Peak Table
The results of a peak table can be used to compare peaks with another sample – for
example, one published in a pharmacopoeia. The results of the process are displayed on the
Peak Table tab in the Viewing Area (Figure 39).
Figure 41 Peak Table tab
Select Peak Detection from the Setup menu to display the Setup Peak Detection tab
and define the thresholds and the algorithm used to identify the peaks.
NOTE: You can also add peak labels to the spectrum using the same thresholds using the
Label Peaks option on the View menu.
 Loading...