5-6
hsb
2
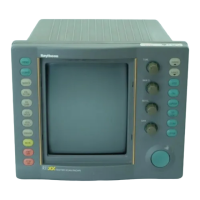
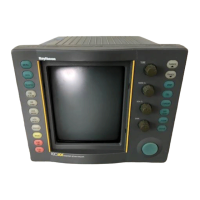
Plus Series Fishfinders
Displaying Chart
Object and Source
Information
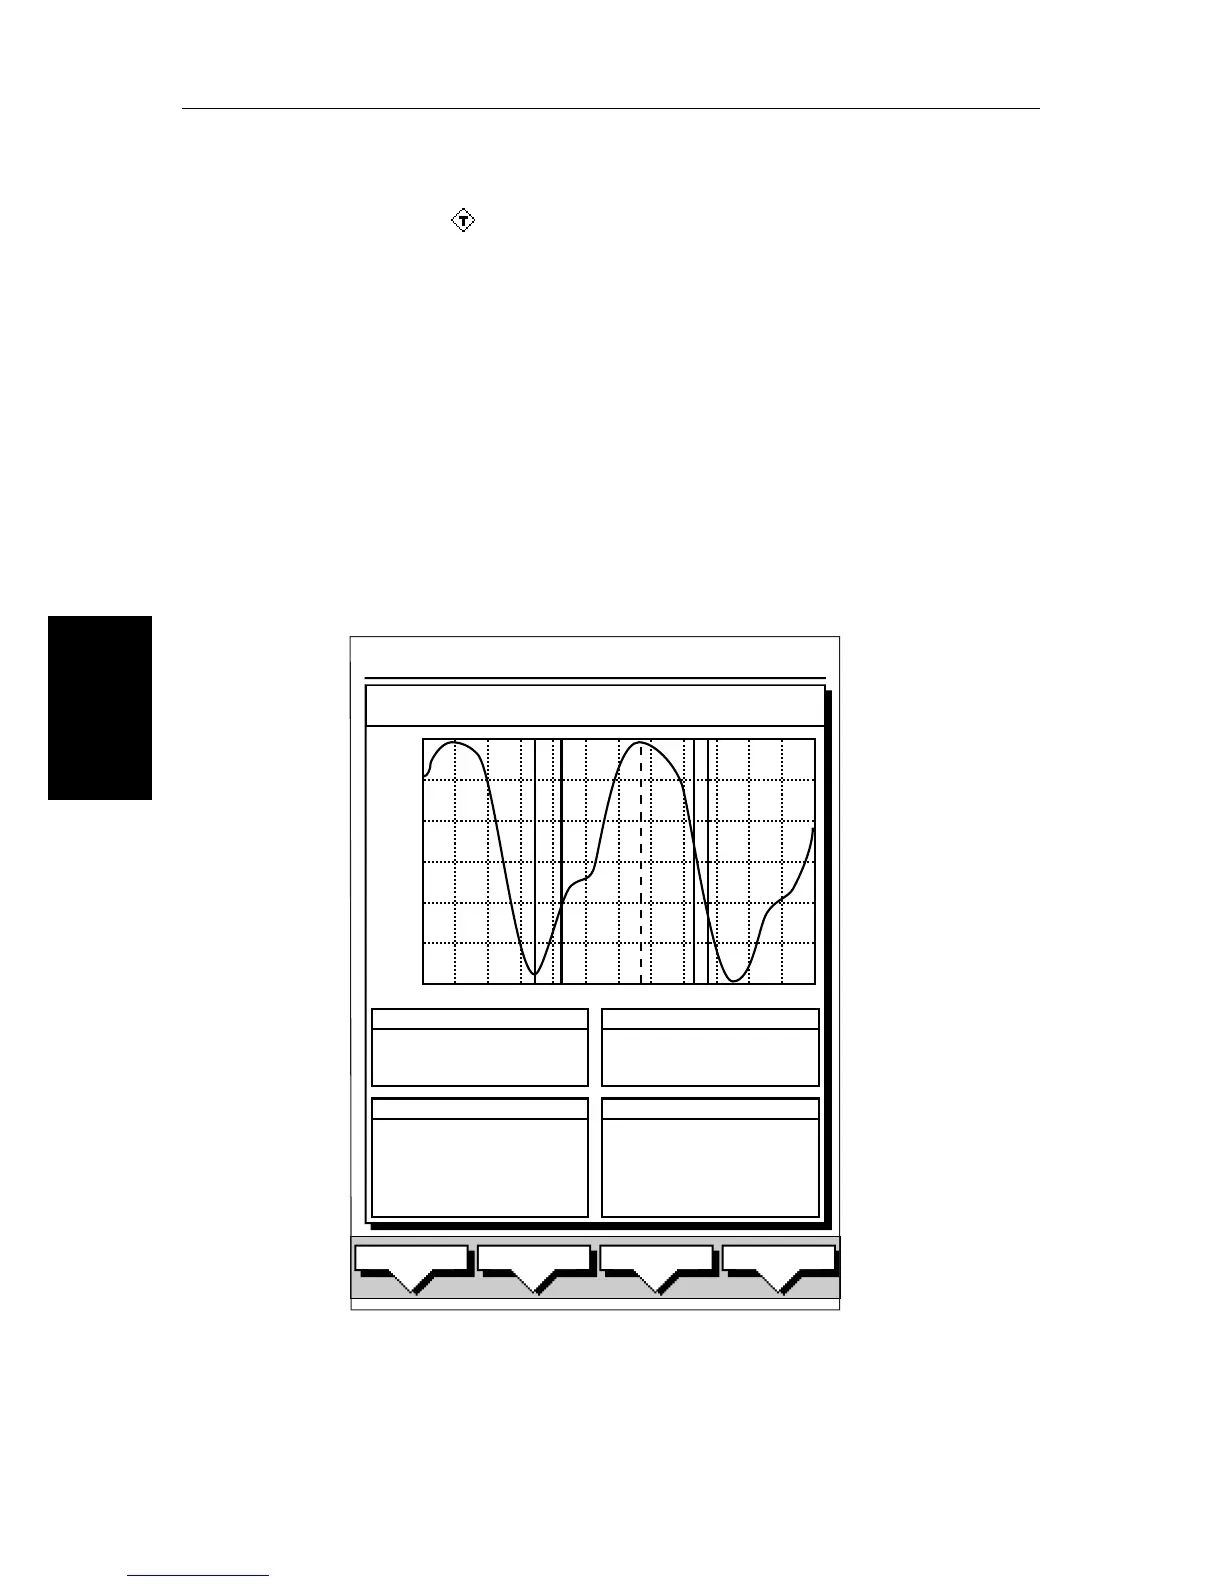
Tide Data
The symbol indicates tide height data is available for that position on the
chart. When you select the tide height option, a graph of predictions for
maximum and minimum tide heights is displayed, data for sunrise and sunset
is also provided as illustrated Figure 5-3.
Note: The predictions available are sufficiently accurate under moderate
weather conditions, for the coastal areas served by the reference station, to be
used for navigation planning. However, certain weather fronts and storms
can alter tidal patterns and influence predicted times and heights.
The cursor, represented by a dotted vertical line on the graph, is used to select
a time for which the tide height is displayed.
You can use the soft keys and trackpad to change the date for which tide
information is shown.
Figure 5-3: Tide Data
PREV. DAY TODAY
SET DATE
NEXT DAY
SUNRISE/SUNSET
TWILIGHT 0805
SUNRISE 0919
SUNSET 2359
TWILIGHT ----
CURSOR
0 2 4 6 8 1012141618202224
TIME 05:37am
HEIGHT 1.41ft
SELECTED DATE
05/14/2000
CSR N 43°04^84
POS W070°44^83
HIGH/LOW WATER
HIGH 0040 8.46ft
LOW 0700 0.10ft
HIGH 1310 8.43ft
LOW 1930 -0.20ft
-0.20
1.25
2.70
4.15
5.60
7.05
8.50
PORTSMOUTH, N.H.
24nm
D5035-1