64 Rockwell Automation Publication PFLEX-RM003E-EN-E - January 2011
Chapter 1 Detailed Drive Operation
IT Protection
The drive’s IT protection dictates the amount of overload capacitors and duty
cycle. Ratings are in the tables listed below. Figure 16
shows expected times.
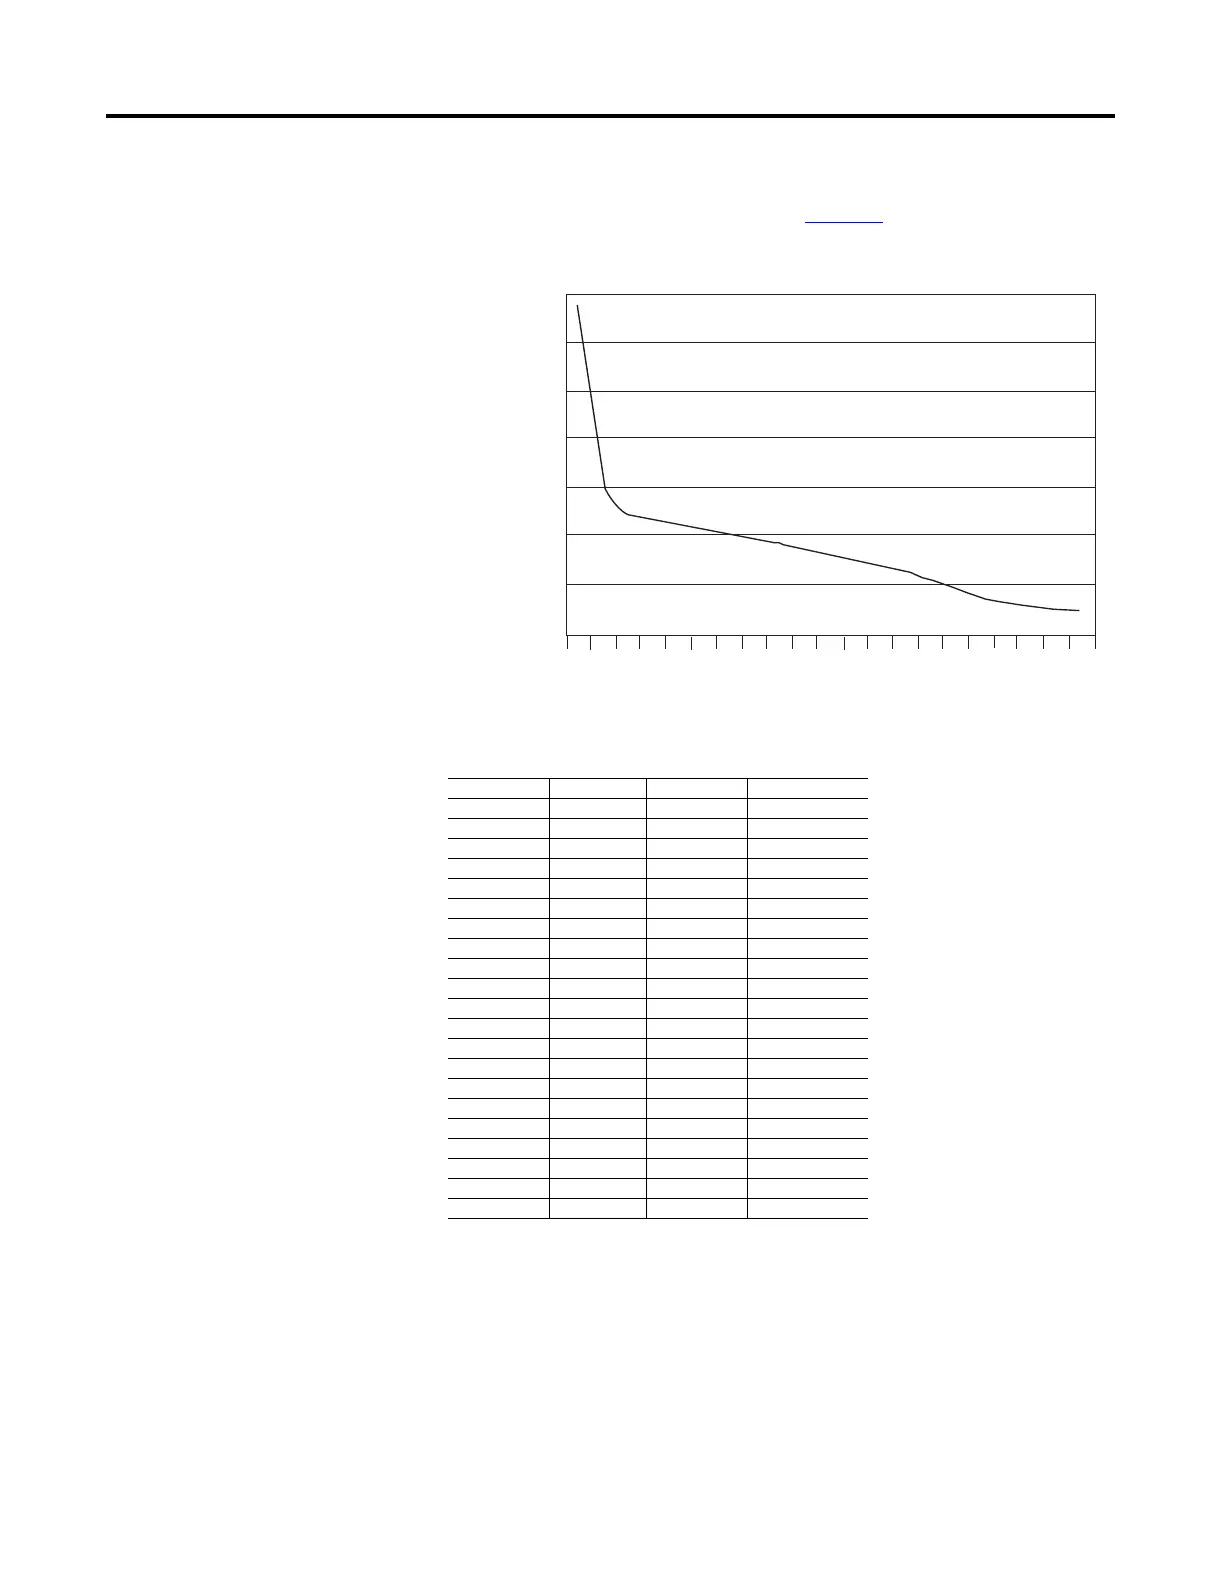
Figure 16 - IT Curve
Time On (s) = time, in seconds, at current level shown
Time Off (s) = time, in seconds, at 100% current
Duty Cycle% = time on / (time on + time off ) x 100
The On Time/Off Time ratio is fixed. If only 1/2 of the listed time is spent at a
given level, only 1/2 of the off time is necessary to reset the cycle.
Current (%) Time On (s) Time Off (s) Duty Cycle (%)
150 3.0 57 5.0
145 3.4 58 5.6
140 3.9 59 6.3
135 4.7 61 7.1
130 5.7 63 8.3
125 7.4 66 10.0
120 10.4 73 12.5
115 17.8 89 16.7
114 20.7 95 17.9
113 24.7 104 19.2
112 3038 117 20.8
111 40.7 138 22.7
110 60.0 180 25.0
109 69.2 180 27.8
108 81.8 180 31.2
107 100.0 180 35.7
106 128.6 180 41.7
105 180.0 180 50.0
104 300.0 180 62.5
103 900.0 180 83.3
102.5 4500000.0 180 100.0
102.5%
104%
106%
108%
110%
112%
114%
120%
130%
140%
150%
10000000.0
1000000.0
100000.0
10000.0
1000.0
100.0
10.0
1.0
Current (%)
Time (sec)
 Loading...