3-5
Level Controller Configuration
Why Autotune?
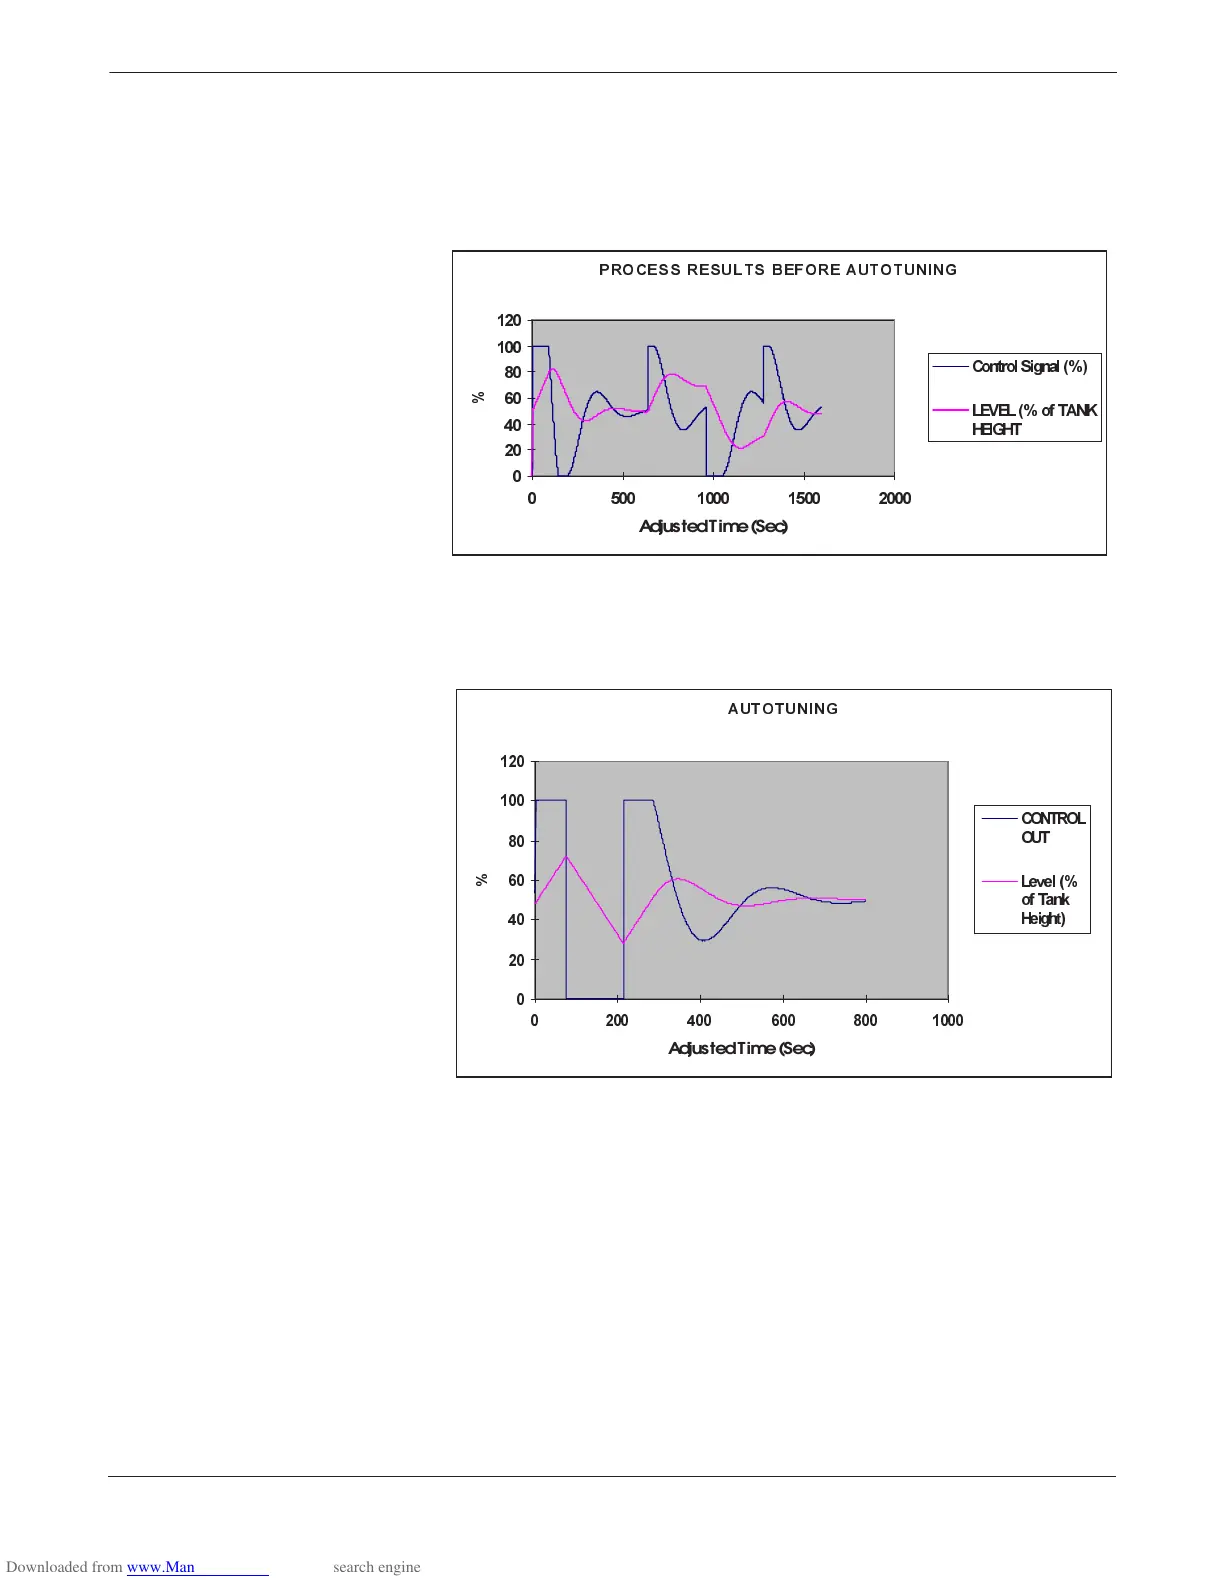
A poorly tuned loop results in poor process level control and excess
stress on the control element. Figure 3-3 illustrates the relationship
between the Control Signal percentage and the Level (or, percent of
tank height) of a poorly tuned loop.
FIGURE 3-3. Example of a Poorly
Tuned Loop.
A properly tuned loop results in significant reductions in process
variability, as shown in Figure 3-4.
FIGURE 3-4. Example of the Same
Loop After Autotuning.
PROCESS RESULTS BEFORE A UTOTUNING
0
20
40
60
80
100
120
0 500 1000 1500 2000
Adj us t ed T i me (S ec)
%
Control Signal (%)
LEVEL (% of TANK
HE IGHT
AUTOTUNING
0
20
40
60
80
100
120
0 200 400 600 800 1000
Adjus t ed T ime (S ec)
%
CONTROL
OU T
Level(%
of Tank
Height)