5. Measurements with the Piranha System
Fluoroscopy and Pulsed Fluoroscopy
Piranha & QABrowser Reference Manual
2014-06/5.5C
106
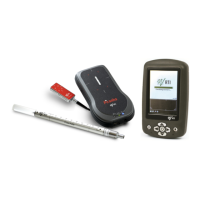
9. Start the fluoroscopy. A little triangle is displayed, indicating that the Piranha has
detected the radiation.
10. The figure to the left shows the real-time
display during fluoroscopy. The image
intensifier input dose rate is measured and
the display is updated approximately every
four seconds. Tap Hold to "freeze" the
currently shown value in the display. The
waveform is also acquired when Hold is
activated.
11. Release hold by tapping Hold again.
12. Stop the fluoroscopy.
13. Read the values.
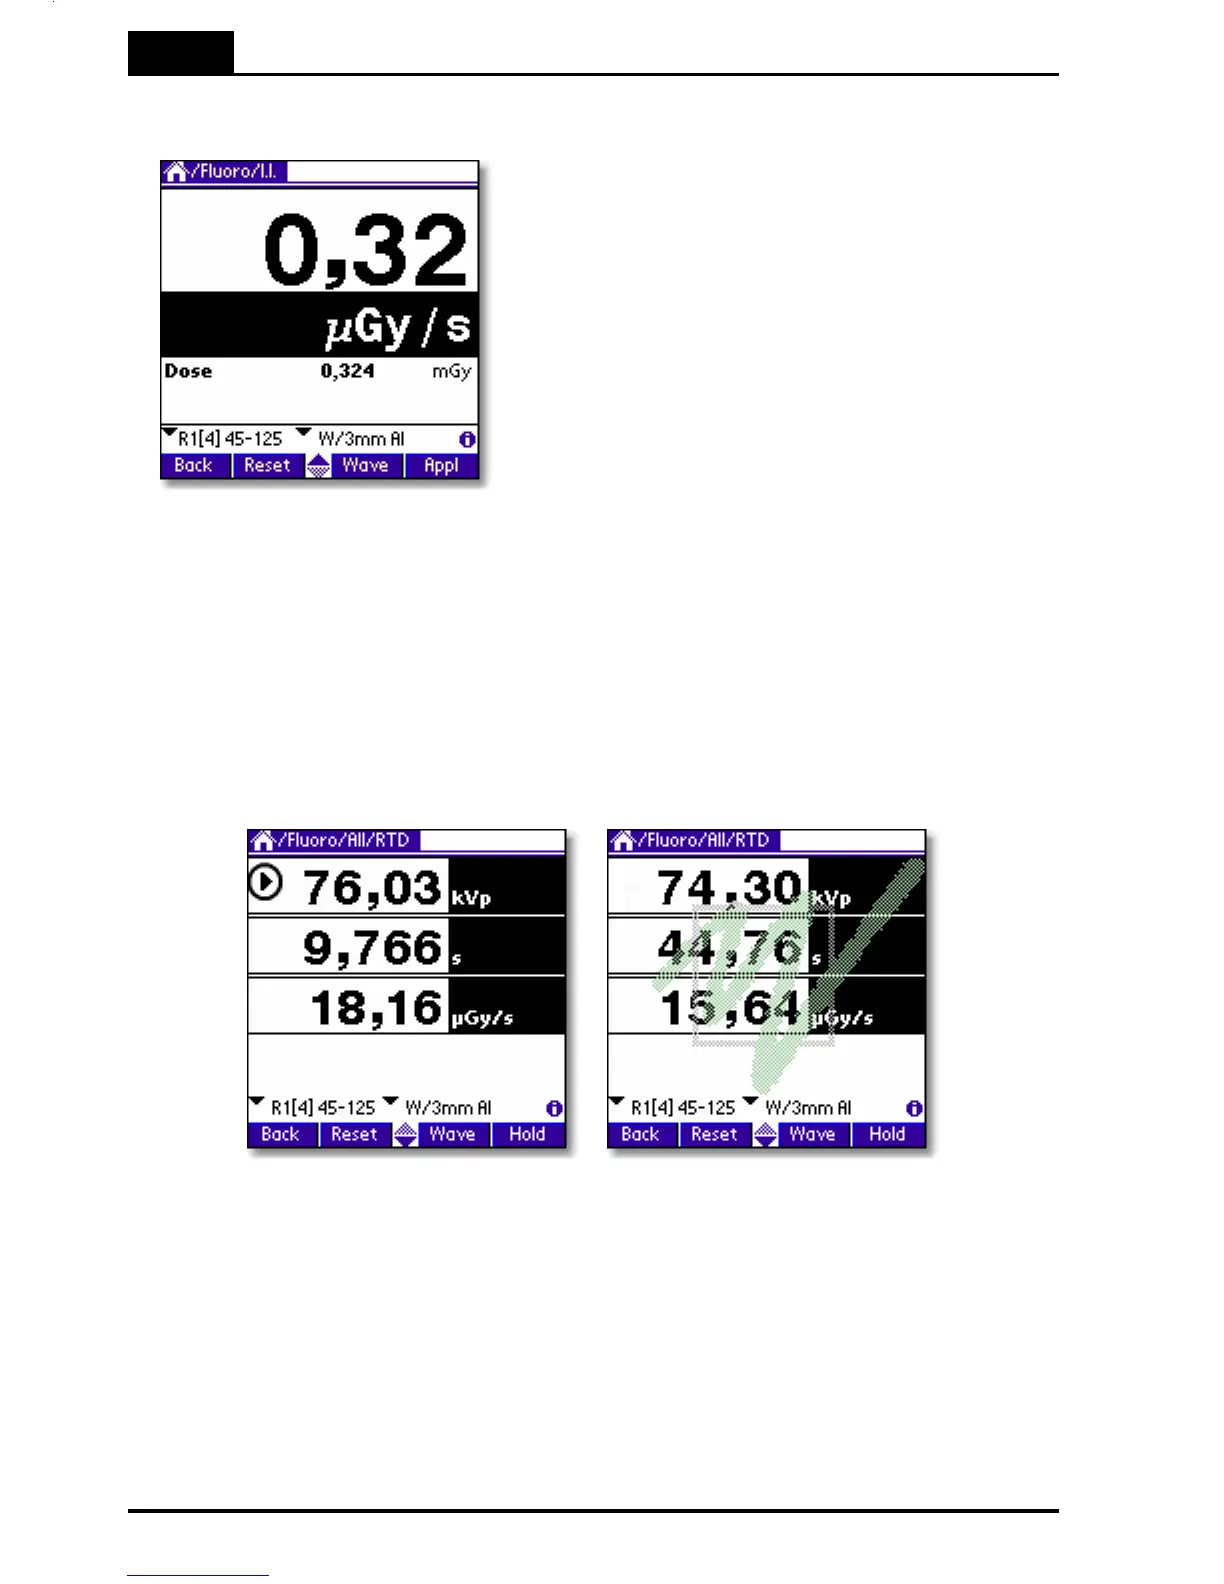
5.4.2 kVp and Dose Rate
Use the same procedure as for the image intensifier input dose rate measurement but
select All... parameters instead.
1. The first screen shows how the continuous updated display looks like. The little black
arrow indicates that the radiation is detected and the display is updating every four
seconds.
2. The second screen shows that the Piranha has detected that the fluoroscopy have
stopped by flashing the logo and then freeze the values. Note that the last registered
kV value may be lower than the one measured during the exposure. The last display
update may occur when the exposure is switched off and the kVp is captured on the
"falling edge". The dose rate shown after the logo flashes is the average dose rate of
the entire exposure.