3. Description of the QABrowser
Real-time Display and Waveforms
2014-06/5.5C
43
Piranha & QABrowser Reference Manual
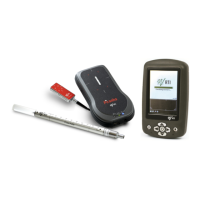
2. The waveforms are displayed and you can
use the pen to move the cursor. Corresponding
cursor values are shown under the waveforms.
3. Tap kVp, Dose…, or mA once to hide/show
the corresponding waveform.
4. You can now make new exposures without returning to the real-time display. The
old waveforms are then erased, and the new ones are shown. If the
waveform recording time is much longer than the exposure time, you may only get a
part of the waveform, since the Piranha is still capturing the waveform. Then you can
go back to the RTD and tap Wave again, when the waveform recording time has
passed, to get the full waveform.
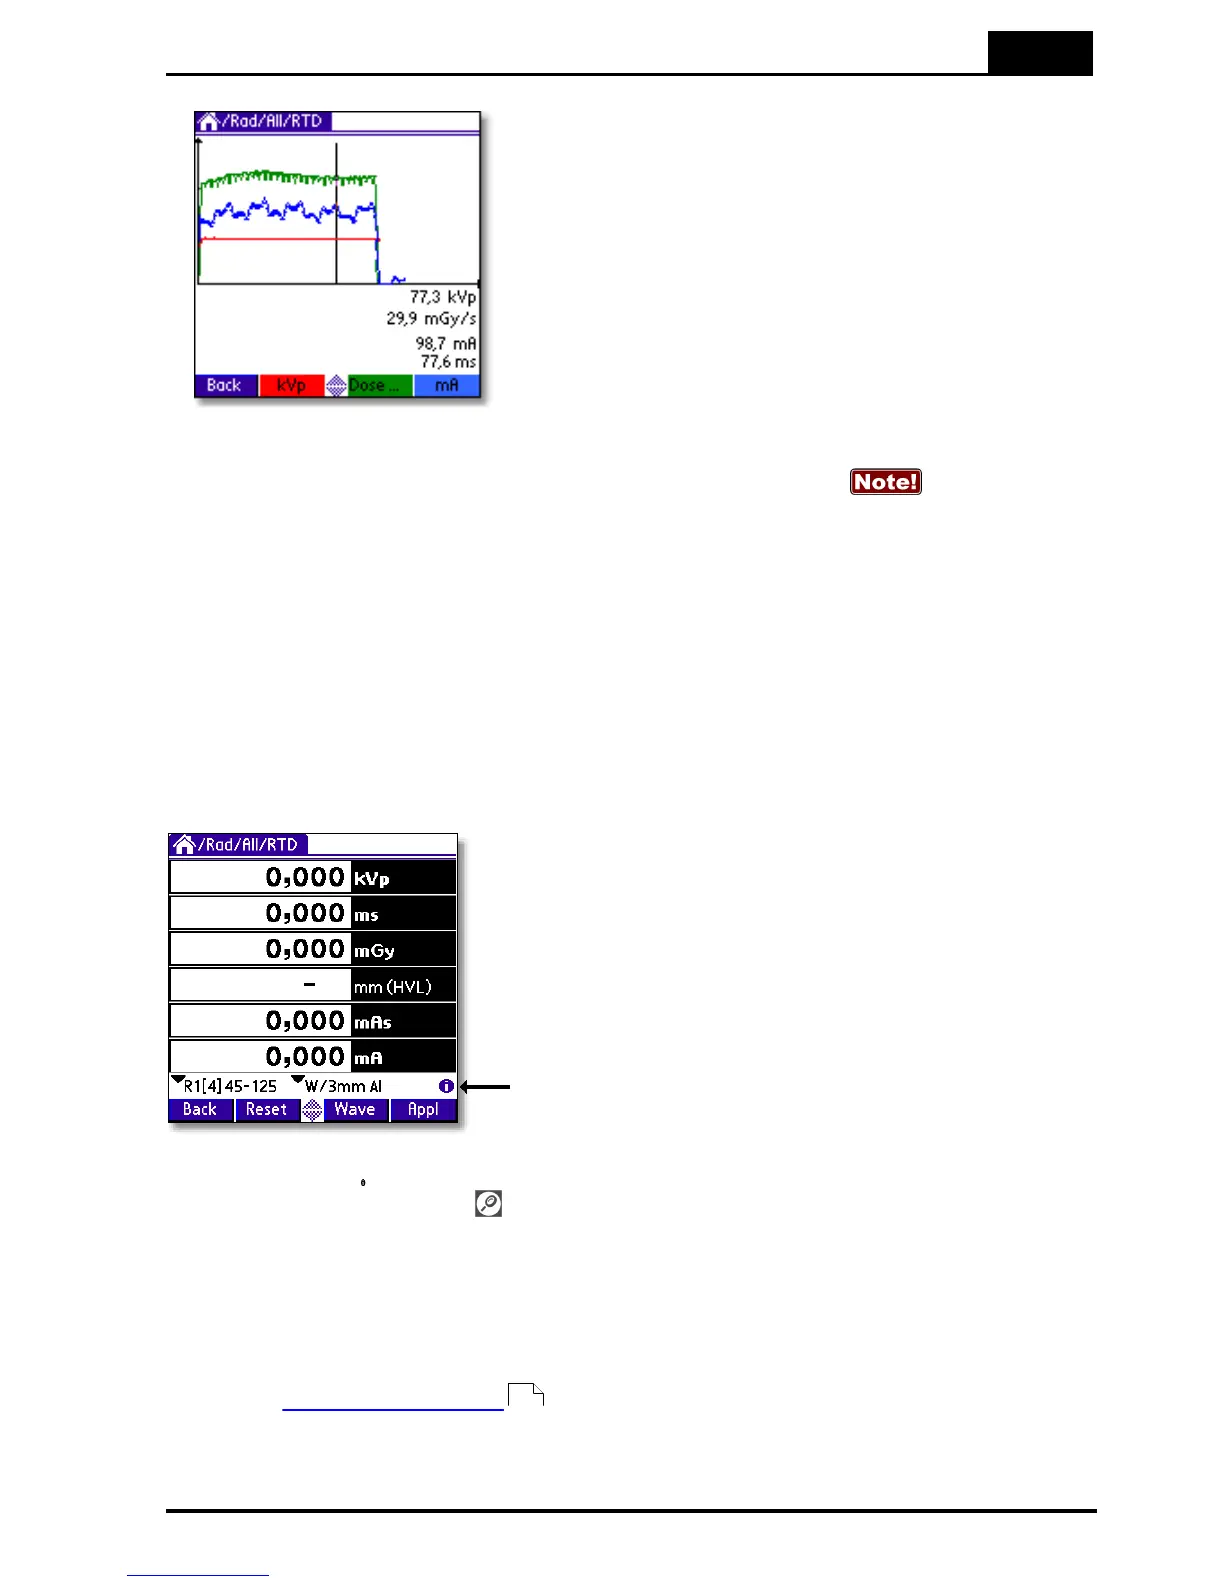
3.3.3 Measurement Settings
As mentioned before all settings of the Piranha are done automatically when you select
type of measurement. For example, when you choose fluoroscopy the detector
sensitivity is set to high. However, there might be situations where the default settings
cannot be used and settings must be adjusted. Use Settings to adjust the Piranha when
necessary. The figure below shows how to access this function.
Tap this symbol to open the screen with
Settings for the Piranha and the various
detectors
When you tap the symbol the Settings screen is shown. This can also be
accomplished by tapping the icon on the graffiti area (or the Tungsten T3, T5, TX
status bar). What is shown here is dependent on selected parameter(s) and used
detectors.
Conditions
Shows general conditions for the measurement. Different values can be shown
depending on selected measured parameter. Details about the Condition screens can
be seen in Settings - Conditions .
45