3. Description of the QABrowser
Data Logging
Piranha & QABrowser Reference Manual
2014-06/5.5C
58
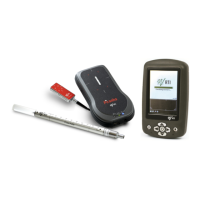
The first thing to do is to start a log session. This is done from Options | Start Log on
the pull-down menu. You open the pull-down menu by tapping or by
tapping the Menu icon to the left of the graffiti area. Activate the log by tapping Start
Log. You will now be asked to enter a Log Note. This can be some kind of information
that you want to save in the log file. Continue with OK or Don't Show if you do not want
to save a note.
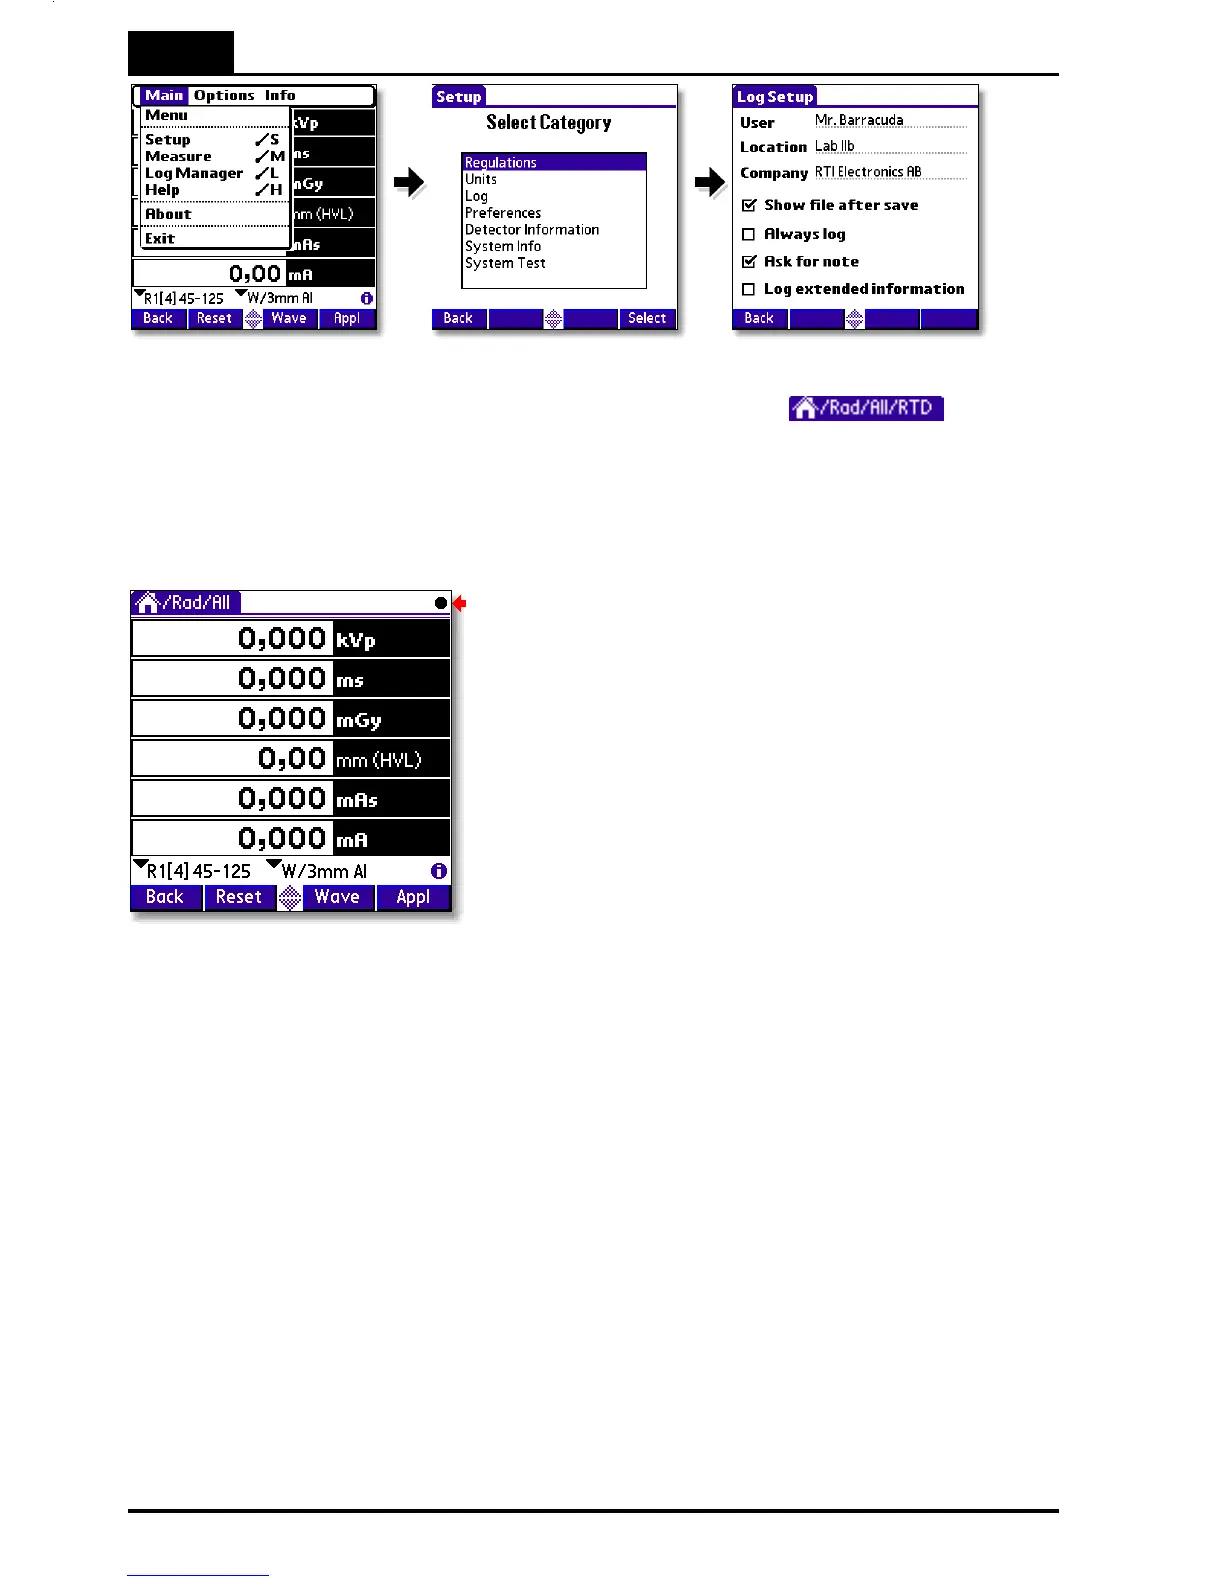
The log is now activated and the result of
each exposure is being saved in the log file.
The active log is indicated with the animated
black symbol at the top of the screen. This
symbol is in motion as long as the data
saved in the log file. Now make some
exposures at some different kV stations.
In After exposure or Timed update modes a value will be written to the log file each time
the exposure indication is shown. For Continuous update mode a value will be stored
each time you tap the Hold button. In applications, the log values are stored when you
exit the application. This means that you can start the log after you have done your
measurements and still get all data to the log.
If you want to pause the log temporarily just select Options | Pause Log on the pull-
down menu. The log is still active but no data is saved in the file (the log indication
"freezes"). This makes it possible to make exposures that are not saved in the log file.
To resume data logging (into the same file) select Options | Pause Log again. If you
got bad reading, you can also use the pull-down menu time
Options | Delete Last Logged Value to delete single values from the log.
Note that when measuring in an Application, the data will not be stored in the log file
until you exit the Application. That means that even if you start the log after you have
begun measuring you will still get all the application measurements in the log file.
 Loading...
