94
Data Output Functions
There are 3 options for data output:
– Output to the display and control unit
– Output to a printer (generate a printout)
– Output to a peripheral device (e.g., computer) via the interface port
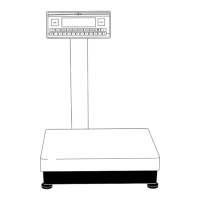
Output to the Display and Control Unit
The display is divided into 9 sections. Information about the scale,
the application being used and the sample weighed is output in the
following sections:
– Line for metrological data
– Bar graph
– Plus/minus sign, stability symbol display
– Measured value line
– Weight unit display
– Data in tare memory; calculated value
– Application symbol display
– Text line
– Soft key labels
Line for Metrological Data (in legal metrology)
This line shows:
– Maximum scale capacity (e.g., 6,200 g)
– Minimum scale capacity; the weight must not go below this limit
when the scale is used in legal metrology (e.g., 10 g)
– Verification interval of the scale; irrelevant if the scale is not used
in legal metrology (e.g., 0.1 g)
– Readability: Indicates the actual scale interval (display increment
of the scale) (e.g., 0.01 g)
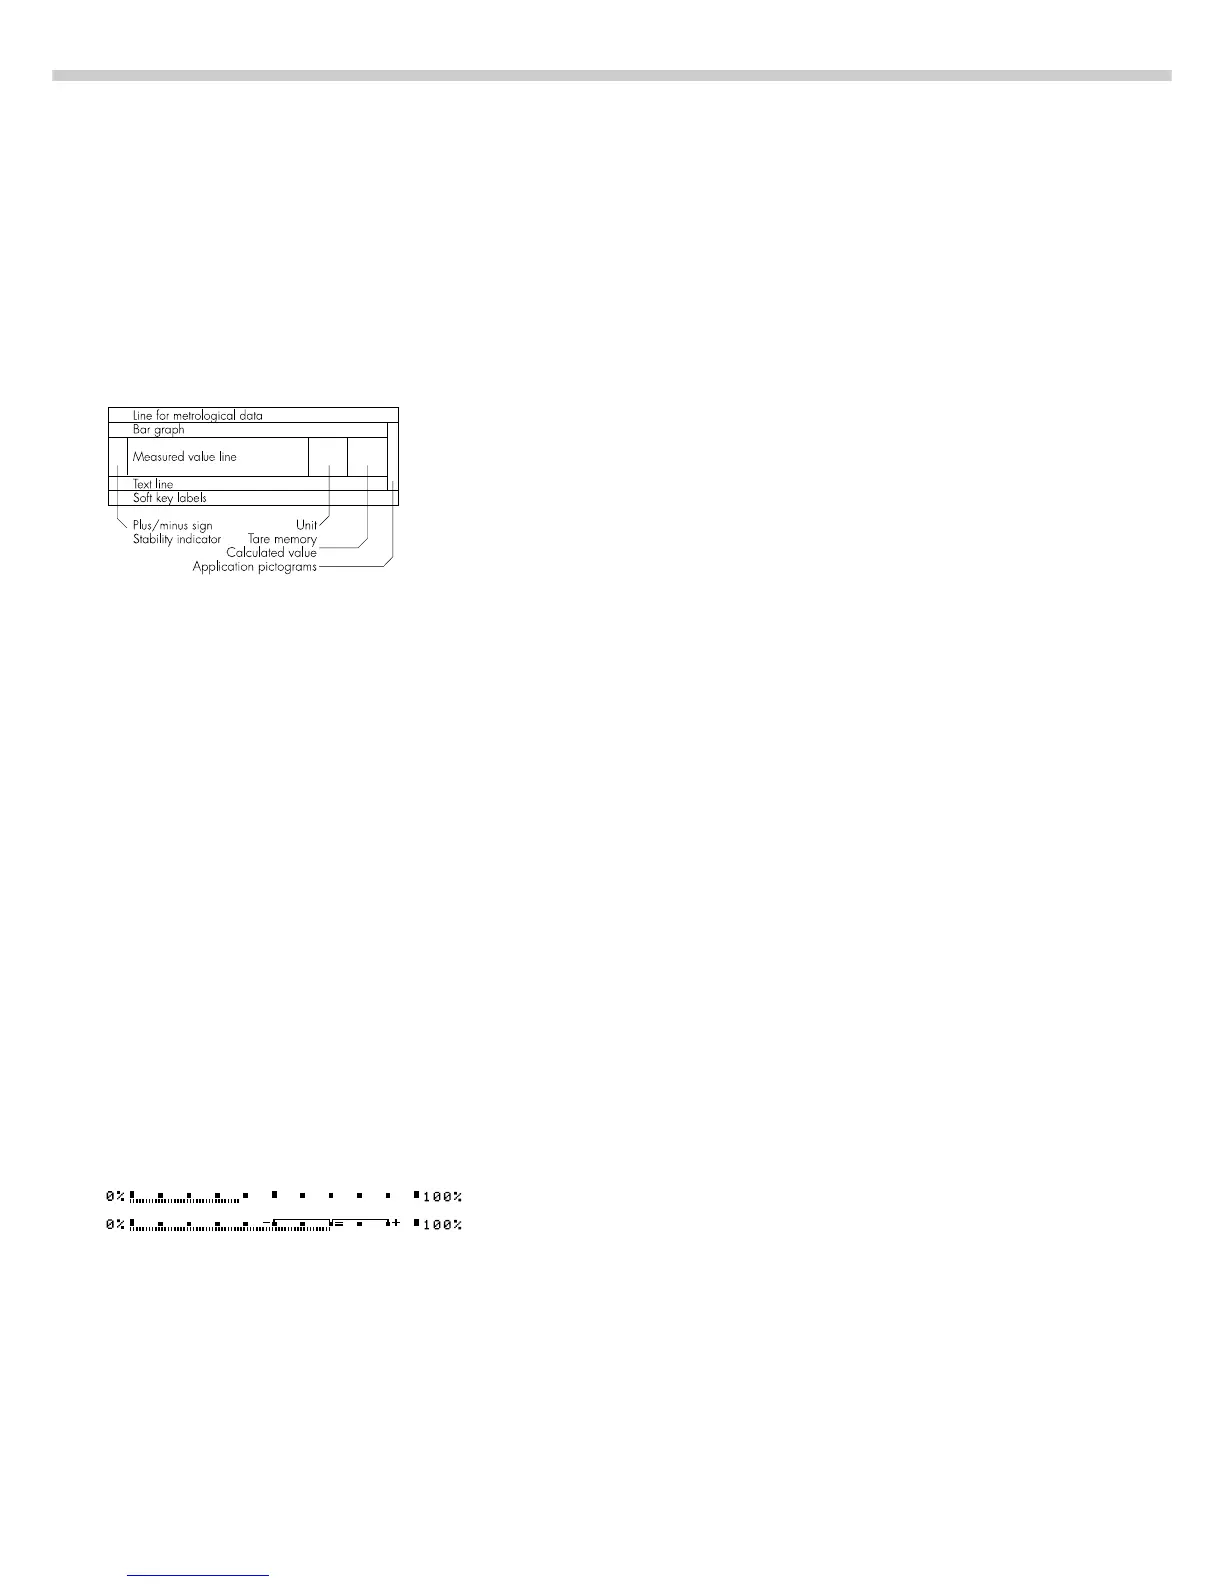
Bar Graph (overview display)
In the bar graph, weighing results are displayed either
– as a percentage of the maximum scale capacity, or
– in relation to a target value, with tolerance limits indicated.
You can turn off (blank) the bar graph display (Setup: App: Basic settings:
Display: Digit size)
Plus/Minus Sign, Stability Symbol
This section shows:
– “Busy” symbol
– Plus or minus sign
– Zero symbol (indicating the scale has been zeroed)
Max6200 g
Min 10 g
e= 0.1g
d= 0.01g
J
F H
S
 Loading...