Doc. 177/5250x
Rev A
9-4
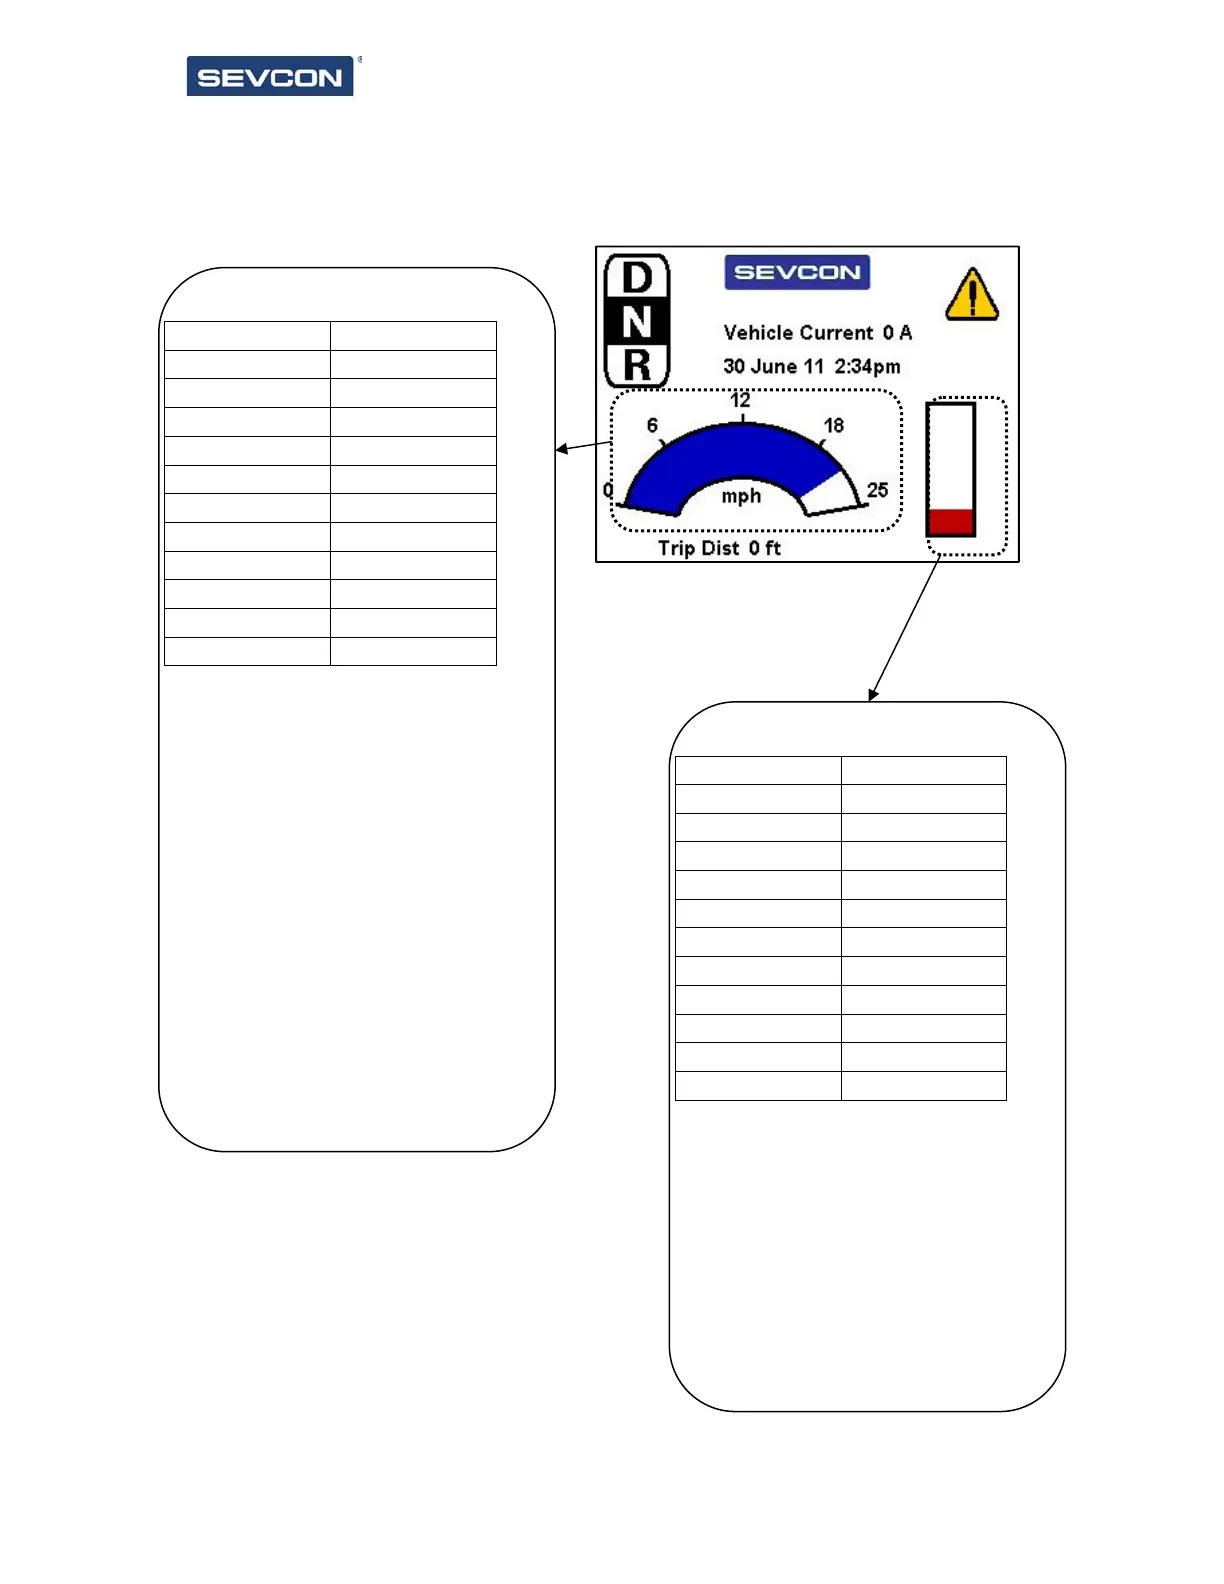
The layout – Arc Graph and Bar Graph
Arc graph showing vehicle speed
Object 0x2900 Value
Sub 1 1
Sub 2 10
Sub 3 105
Sub 4 2
Sub 5 0x0001
Sub 6 180
Sub 7 150
Sub 8 10
Sub 9 170
Sub 10 40
Sub 11 640
Sub 1 (1) for an arc graph, located at (x,y)
location of (10,105). Associated DO of 2,
which is the vehicle speed.
Sub 5 (0x01) graph is clockwise filled
showing signed values if object is signed.
Arc comprised of ellipse which is overall size
180 pixels by 150 pixels. Thickness of the
graph is 40 pixels.
Start angle is 10 degrees, end angle 170
degrees. Maximum value of 640, which
considering the scale factor 0f x16 is 40kmh.
Display has been set to imperial units, so
speed is then shown as mph, and scaled
accordingly.
Bar graph showing battery state.
Object 0x2901 Value
Sub 1 2
Sub 2 250
Sub 3 120
Sub 4 6
Sub 5 0x0000
Sub 6 40
Sub 7 100
Sub 8 20
Sub 9 99
Sub 10 0
Sub 11 65535
Sub 1 (2) for a bar graph, located at (x,y)
location of (250,120). Associated DO of 6,
which is the BDI charge remaining.
Sub 5 (0x00) graph is filled upwards, with
no tick marks.
Graph is a rectangle, overall size 40 pixels by
100 pixels.
Graph shows red, as min alarm limit is set to
20%, and BDI level is just below this.