Doc. 177/5250x
Rev A
6-10
The Arc Graph
The arc graph is a curved analogue graph. This is intended to show a variety of data
including speed and motor RPM.
The graph is constructed from the data parameters which can fully control the shape and
appearance on screen. First, a brief explanation of angles and ellipses is required.
The graph is intended to have tick marks around the outer edge, with values suitable to the
selected data object.
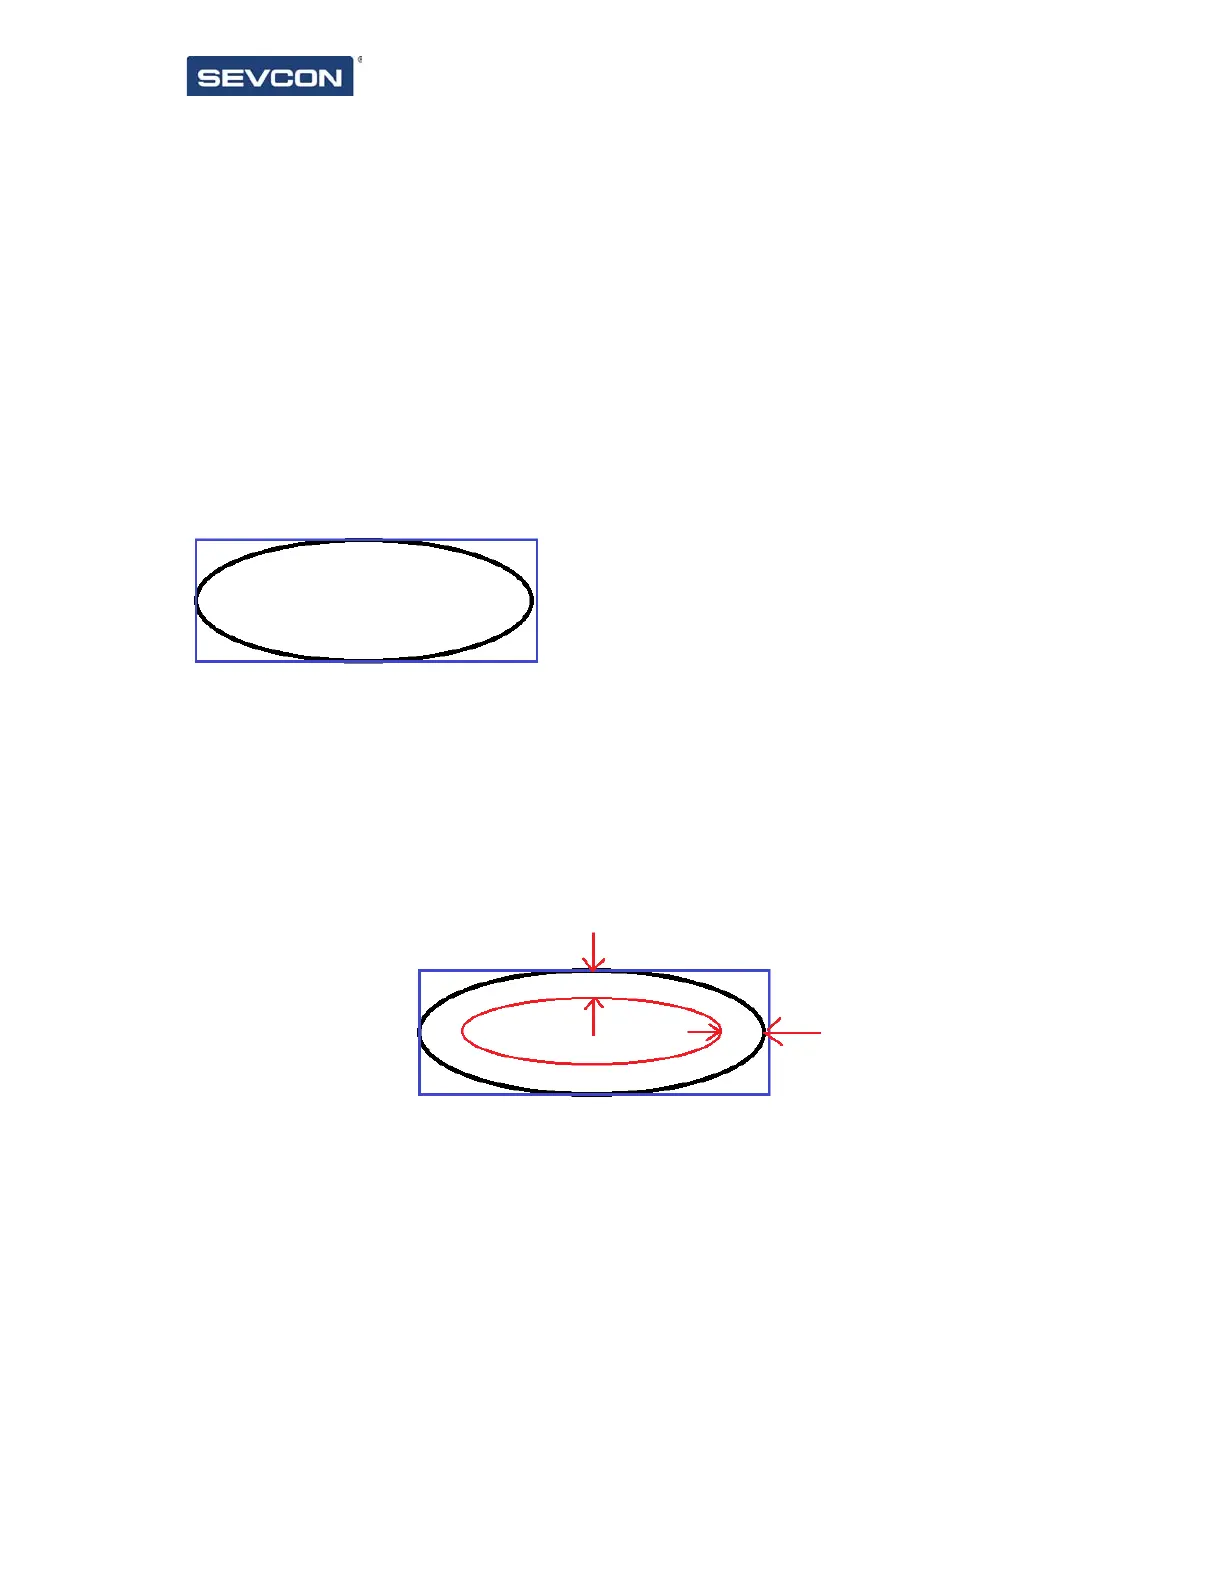
Ellipse shapes and the bounding rectangle.
An ellipse drawn on screen is defined through the size of the bounding rectangle, e.g.:
The black ellipse is contained within the blue bounding rectangle. This means that we can
define the shape of the graph on screen by changing the size of this rectangle. Using the
example above, our x size and y size (in pixels) could be 400 (x width) and 200 (y height).
This (x,y) size will define the outer arc shape.
The inner arc shape is then defined with a graph thickness. This is the number of pixels
between the inner and outer ellipses, e.g.:
The graph thickness (space between inner and outer arcs) is applied equally to the x and y
sizes to produce 2 arcs, one centred within the other.
This leaves a doughnut shaped item. To create the graph, we need to specify the start and
end angle of the arc. The reference angles are as shown below: