Reactive Power Q2 for Phase 2
(Address, see Table B-16) This register contains the minimum values and the maximum values of the reactive
power for phase 2 measured every 15/30/45/60 minutes, 24 hours, 1 month, and 1 year respectively.
Refer to Reactive Power Q1 for Phase 1, Page 154.
Reactive Power Q3 for Phase 3
(Address, see Table B-16) This register contains the minimum values and the maximum values of the reactive
power for phase 3 measured every 15/30/45/60 minutes, 24 hours, 1 month, and 1 year respectively.
Refer to Reactive Power Q1 for Phase 1, Page 154.
Apparent Power S1 for Phase 1
(Address, see Table B-16) This register contains the minimum values and the maximum values of the apparent
power for phase 1 measured every 15/30/45/60 minutes, 24 hours, 1 month, and 1 year respectively.
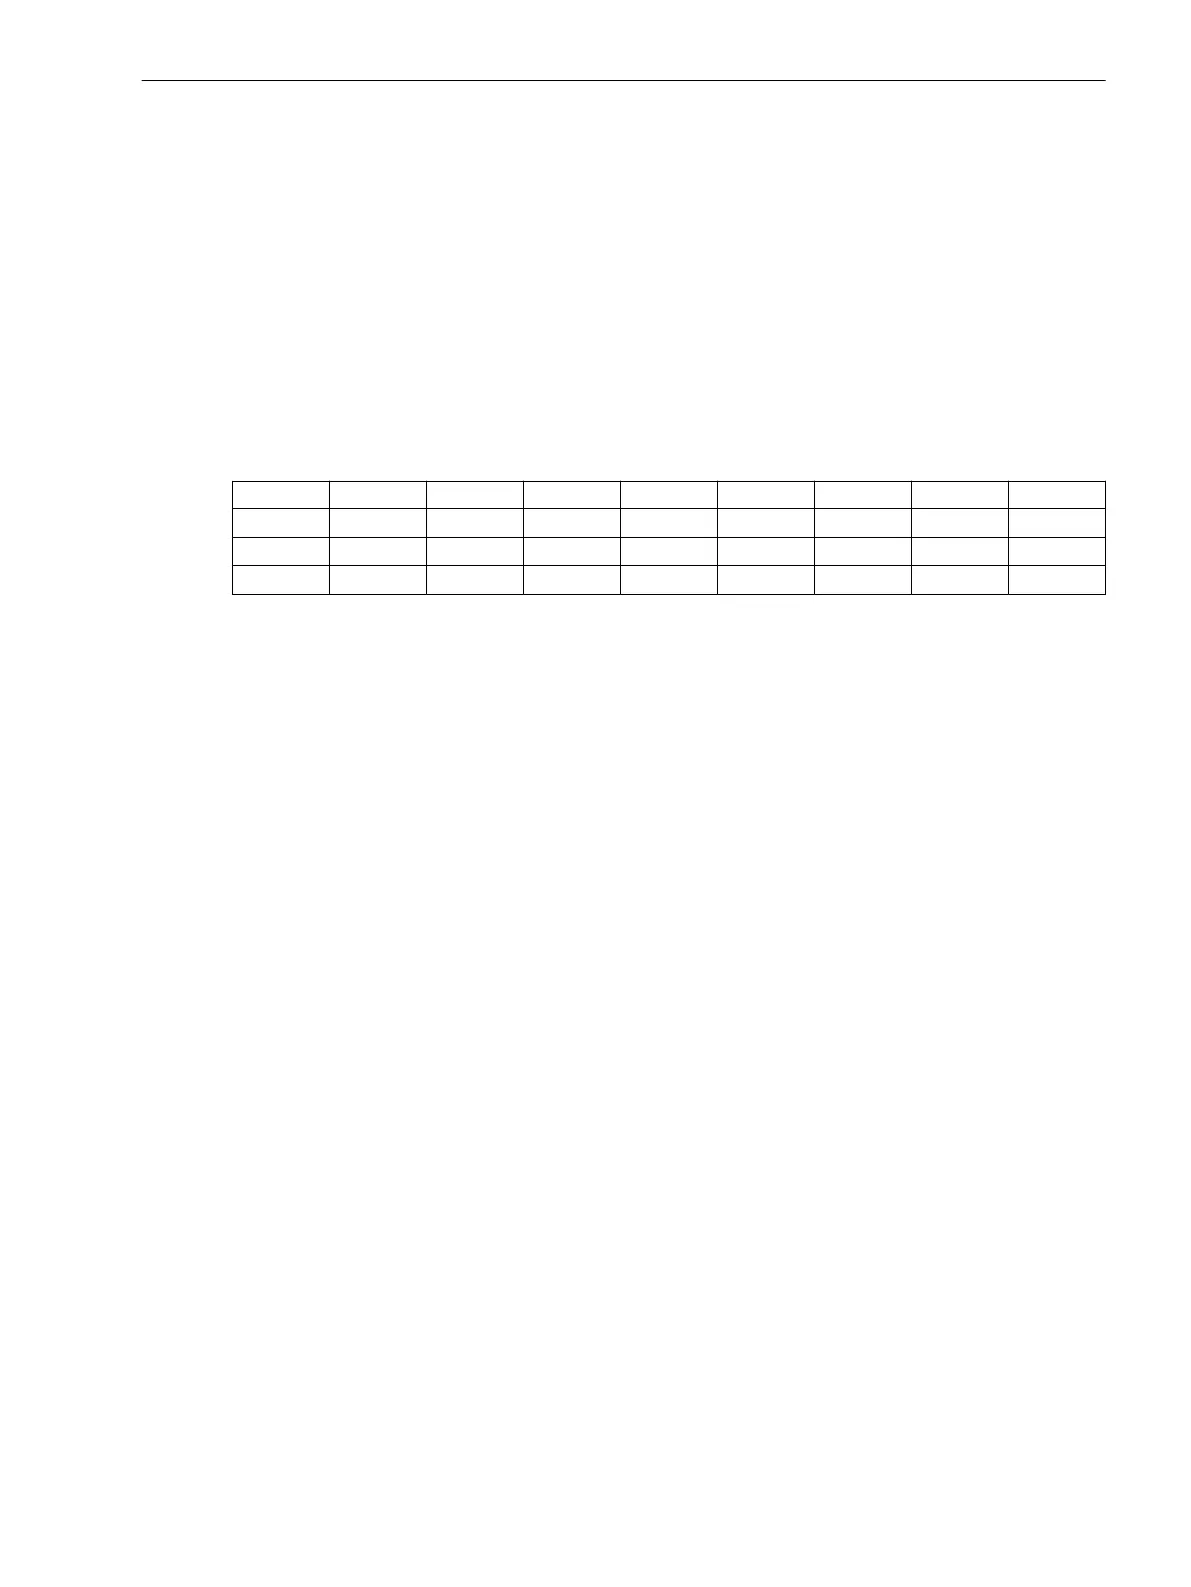
Bit 15 14 13 12 11 10 9 8
2
15
2
14
2
13
2
12
2
11
2
10
2
9
2
8
Bit 7 6 5 4 3 2 1 0
2
7
2
6
2
5
2
4
2
3
2
2
2
1
2
0
Format 16-bit unsigned integer
Unit 1/10 kVA for 230-V sensor
1 kVA for 3.25/√3 sensor, for 100/√3 sensor, and for 400/√3 sensor
Range 0 to 65535
Apparent Power S2 for Phase 2
(Address, see Table B-16) This register contains the minimum values and the maximum values of the apparent
power for phase 2 measured every 15/30/45/60 minutes, 24 hours, 1 month, and 1 year respectively.
Refer to Apparent Power S1 for Phase 1, Page 155.
Apparent Power S3 for Phase 3
(Address, see Table B-16) This register contains the minimum values and the maximum values of the apparent
power for phase 3 measured every 15/30/45/60 minutes, 24 hours, 1 month, and 1 year respectively.
Refer to Apparent Power S1 for Phase 1, Page 155.
Modbus Registers
B.8 Register-Type Data – Trailing Pointers
SICAM, Feeder Condition Monitor, Manual 155
E50417-H8940-C580-A4, Edition 03.2019
 Loading...