Configuring with the WBM
7.3 The menu items of the WBM
SIMATIC RF650R/RF680R/RF685R
90 Configuration Manual, 03/2018, C79000-G8976-C386-06
The graph shows the course of the measured radiated power(dBm value) of the selected
antenna over time (black line) and the RSSI values of all selected transponders (colored
lines/dots). Using the icons, you can modify the display of the graph and adapt it to your
needs.
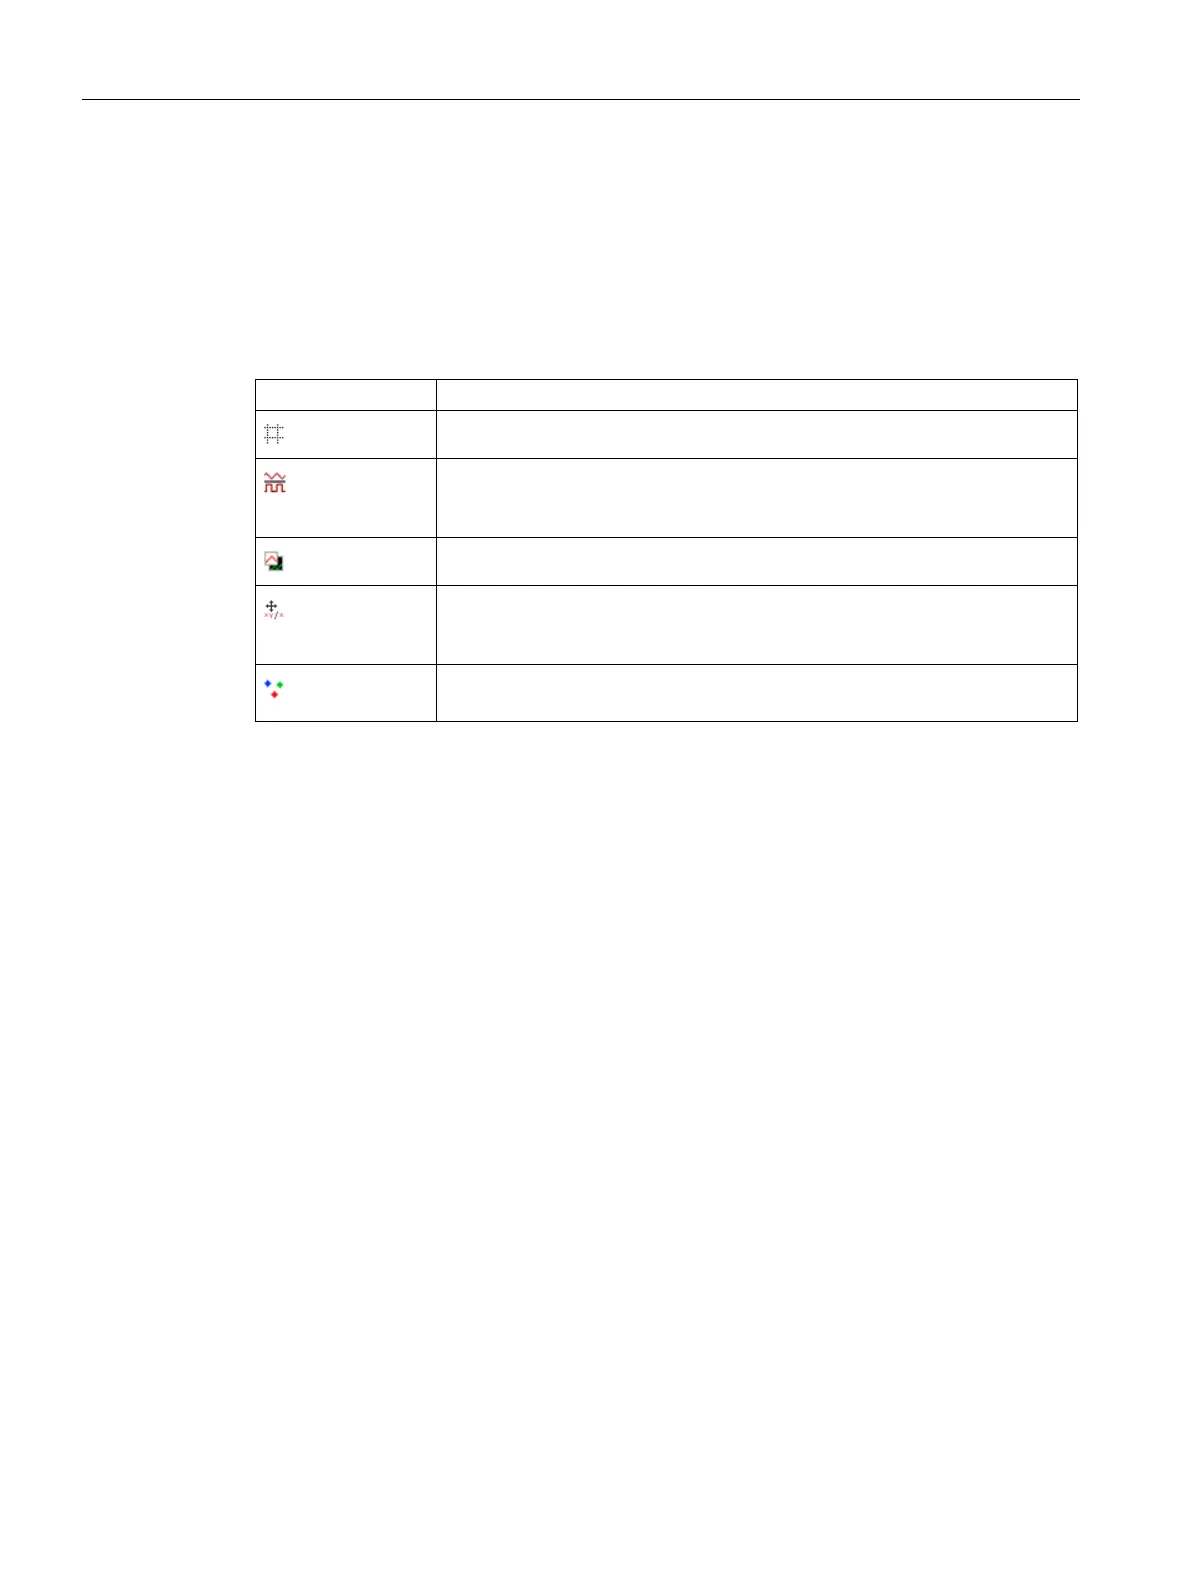
Table 7- 23 Buttons of the RSSI graph
Show/hide grid lines
Change RSSI curve types
Measured values are joined together either with a direct line or using horizon-
Change over the background color, between white and black
Make RSSI graph moveable / fixed
The RSSI graph is either fixed or the zero point of the graph can be moved
holding down the left mouse button.
Highlight RSSI measured values
Display measured values with thin or thick points.
The current RSSI value of the last selected transponder or the number of valid transponders
is also displayed as a numerical value. You can control the value that is displayed using the
radio buttons. Using the arrow symbols, you can expand or reduce the window for the
numeric RSSI value.