Configuring with the WBM
7.3 The menu items of the WBM
SIMATIC RF650R/RF680R/RF685R
94 Configuration Manual, 03/2018, C79000-G8976-C386-06
Acquisition cycles Number of times the reader identified the transponder.
An inventory means a scan on the air on one antenna and with one polariza-
tion.
Not to be confused with number of inventories: Cup with a single inventory, all
antennas with all polarizations are queried.
Date/time Time stamp when the transponder was identified the first time.
The graph shows the course of the measured radiated power(dBm value) of the selected
antenna over time (black line) and the RSSI values of all selected transponders (colored
lines/dots). Using the icons, you can modify the display of the graph and adapt it to your
needs.
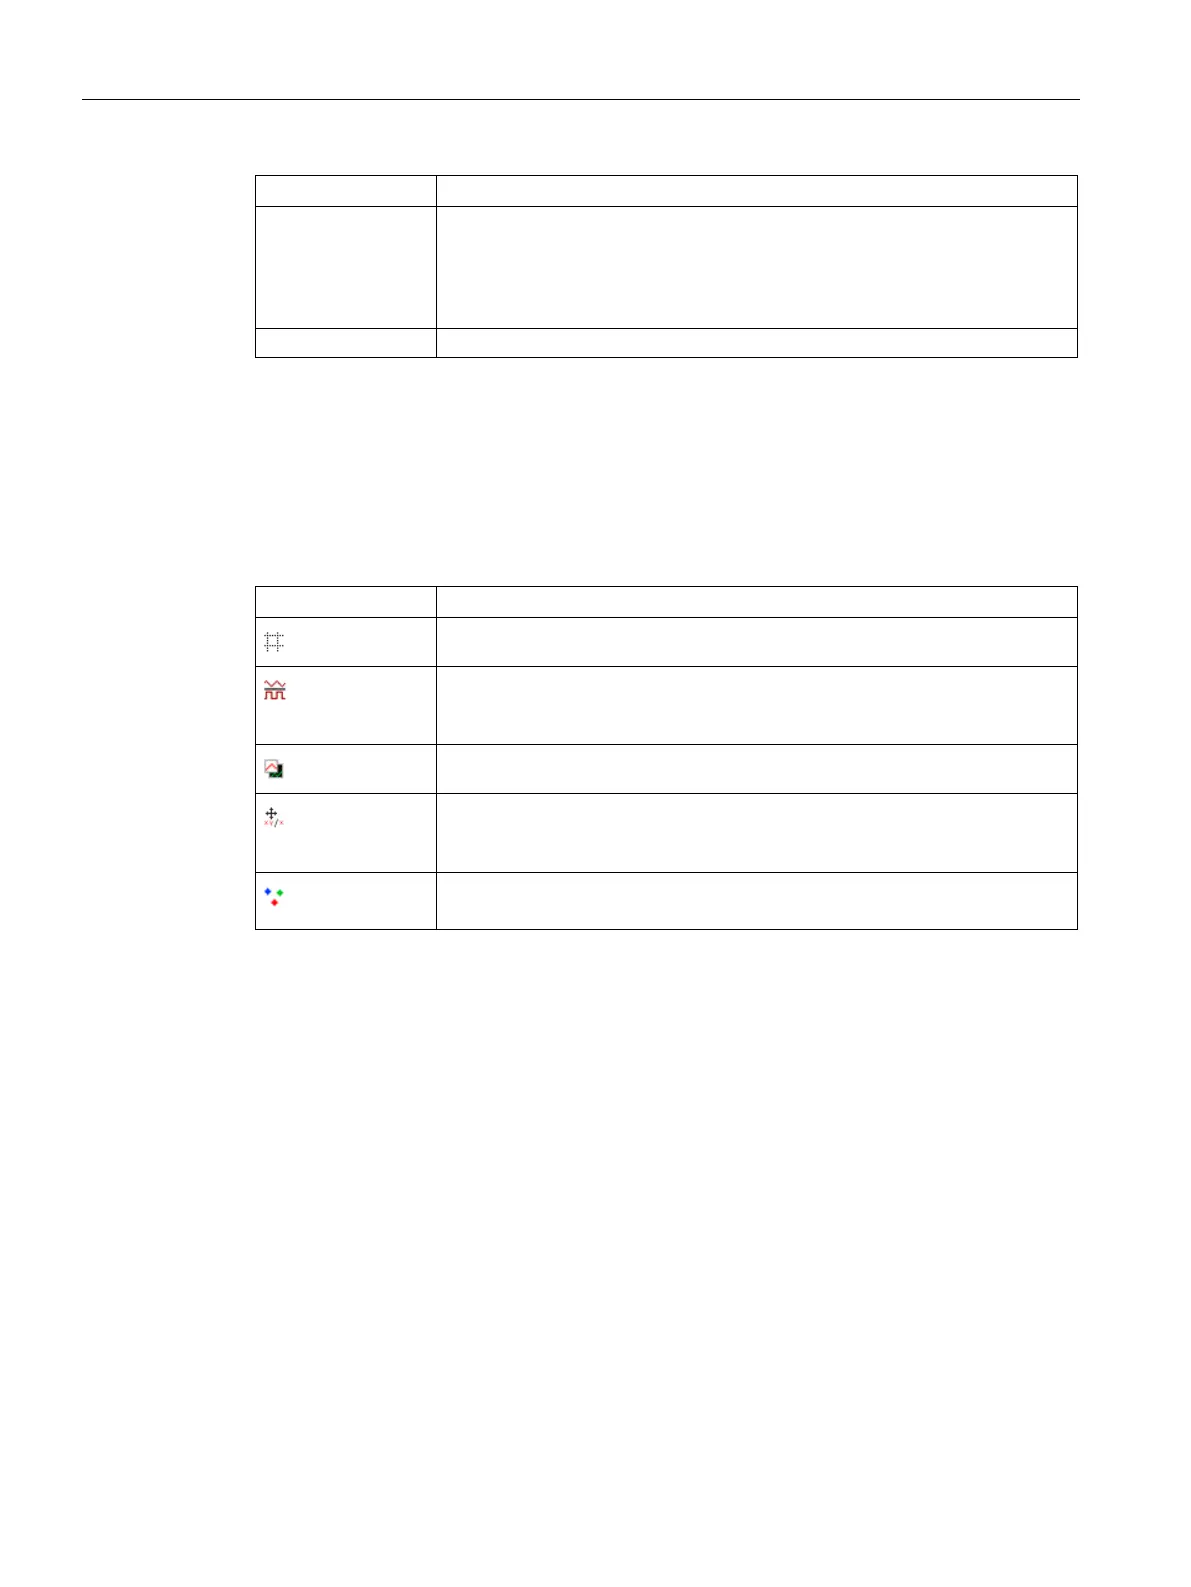
Table 7- 25 Buttons of the RSSI graph
Show/hide grid lines
Change RSSI curve types
Measured values are joined together either with a direct line or using horizon-
Change over the background color, between white and black
Make RSSI graph moveable / fixed
The RSSI graph is either fixed or the zero point of the graph can be moved
holding down the left mouse button.
Highlight RSSI measured values
Display measured values with thin or thick points.
In the "Recording time" input box, you can specify the duration of the recording shown in the
graph. With the aid of the gray shift bar, you can move the recording time of the draft
forwards or backwards.
The current RSSI value of the last selected transponder or the number of valid transponders
is also displayed as a numerical value. You can control the value that is displayed using the
radio buttons. Using the arrow symbols, you can expand or reduce the window for the
numeric RSSI value.
In this area you can have these statuses of the digital inputs/outputs displayed. Inputs on a
gray background indicate that the inputs are either not connected or that no signal with the
minimum voltage is applied (see also the section "Connection scheme for the digital I/O
interface" of the system manual "SIMATIC RF600"). Outputs shown on a gray background
indicate that the output is logically set to the value "0" or is turned off. If an input or an output
is shown on a green background, this indicates logical status "1" or that the output is turned
on or that a signal is applied to the input.
You can use this function to control the outputs. To make changes, you need to click the
"Apply" button.