Control During Operation
7-8 7SA6 Manual
C53000-G1176-C156-2
The inception of a fault is identified with the date and time in hours, minutes, and sec-
onds (resolution to ms). See the example in Figure 7-7.
The individual messages that are associated with the fault are tagged with a relative
time. At least one complete individual message always appears in the display.
Figure 7-7 Example of fault messages in the front display
Usethe and keystomoveupanddowninthefaultmessages.
Usethe keytomovebackintothe
TRIP LOG level; or press the key to go back
to the
MAIN MENU.
From PC with
DIGSI
®
4
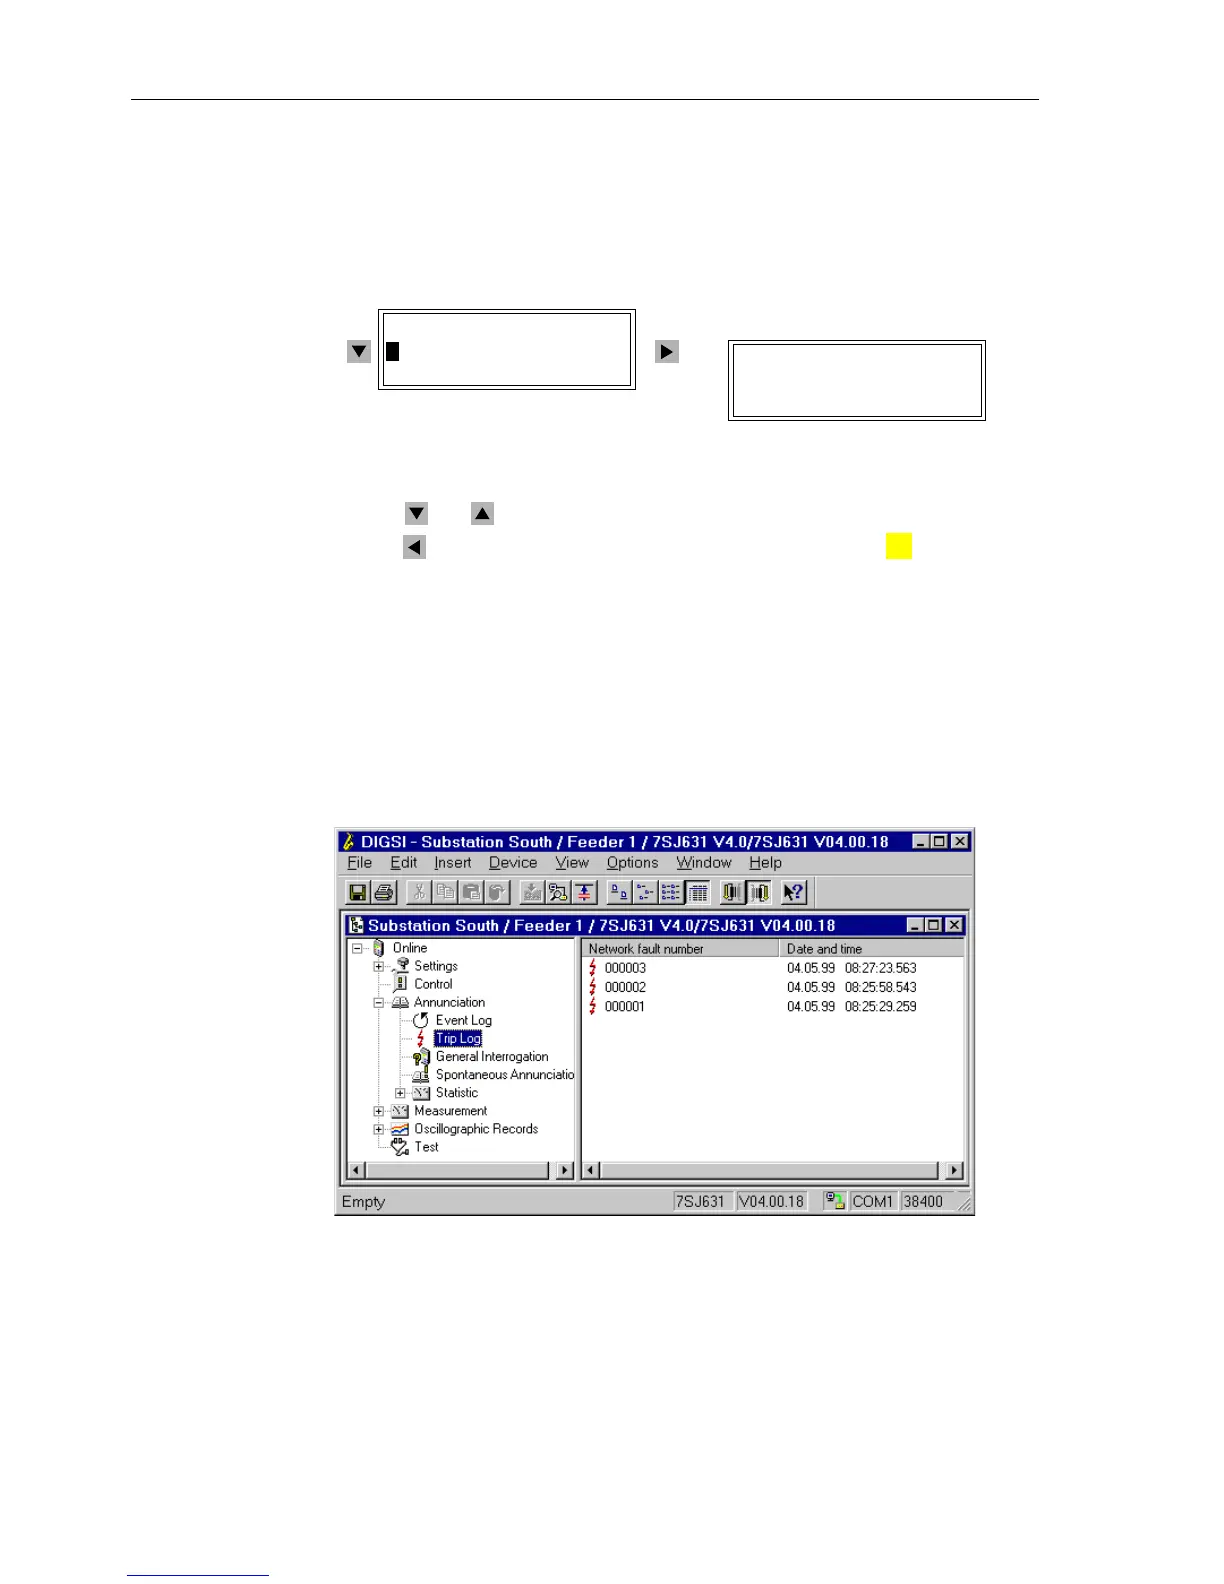
Click on Annunciation. The options appear in the data window (see Figure 7-2).
Double click on the desired message group in the data window, in this case the
Trip
Log
.Alistappearsinthedatawindow,asshowninFigure7-8.
By double clicking on an entry in the list view, the associated contents of the network
fault is displayed in another window. The entries are chronologically listed with the
newest message appearing first.
Figure 7-8 Selection of fault messages in DIGSI
®
4 — example
TRIP LOG 01/08
---------------------
>Last Fault –> 1
>2nd Last Fault –> 2
etc
LAST FAULT 01/10
---------------------
06/22 23:49:34,845
Network Fault 6 ON
MENU
:
 Loading...