Control During Operation
7-26 7SA6 Manual
C53000-G1176-C156-2
7.1.4 Fault Records
Waveform or RMS data is stored in the device and can be graphically represented on
a personal computer using DIGSI
®
4, together with the graphic program SIGRA 4. The
settings associated with fault recording — such as duration and pre- and post-trigger
times — had been are set according to Chapter 6.
7.1.4.1 Viewing Fault Records
From PC with
DIGSI
®
4
Toviewthefaultrecordingdataonascreen,oneoftheprogramsSIGRA4orCom-
trade Viewer (included with SIMATIC Manager) is needed. Do the following:
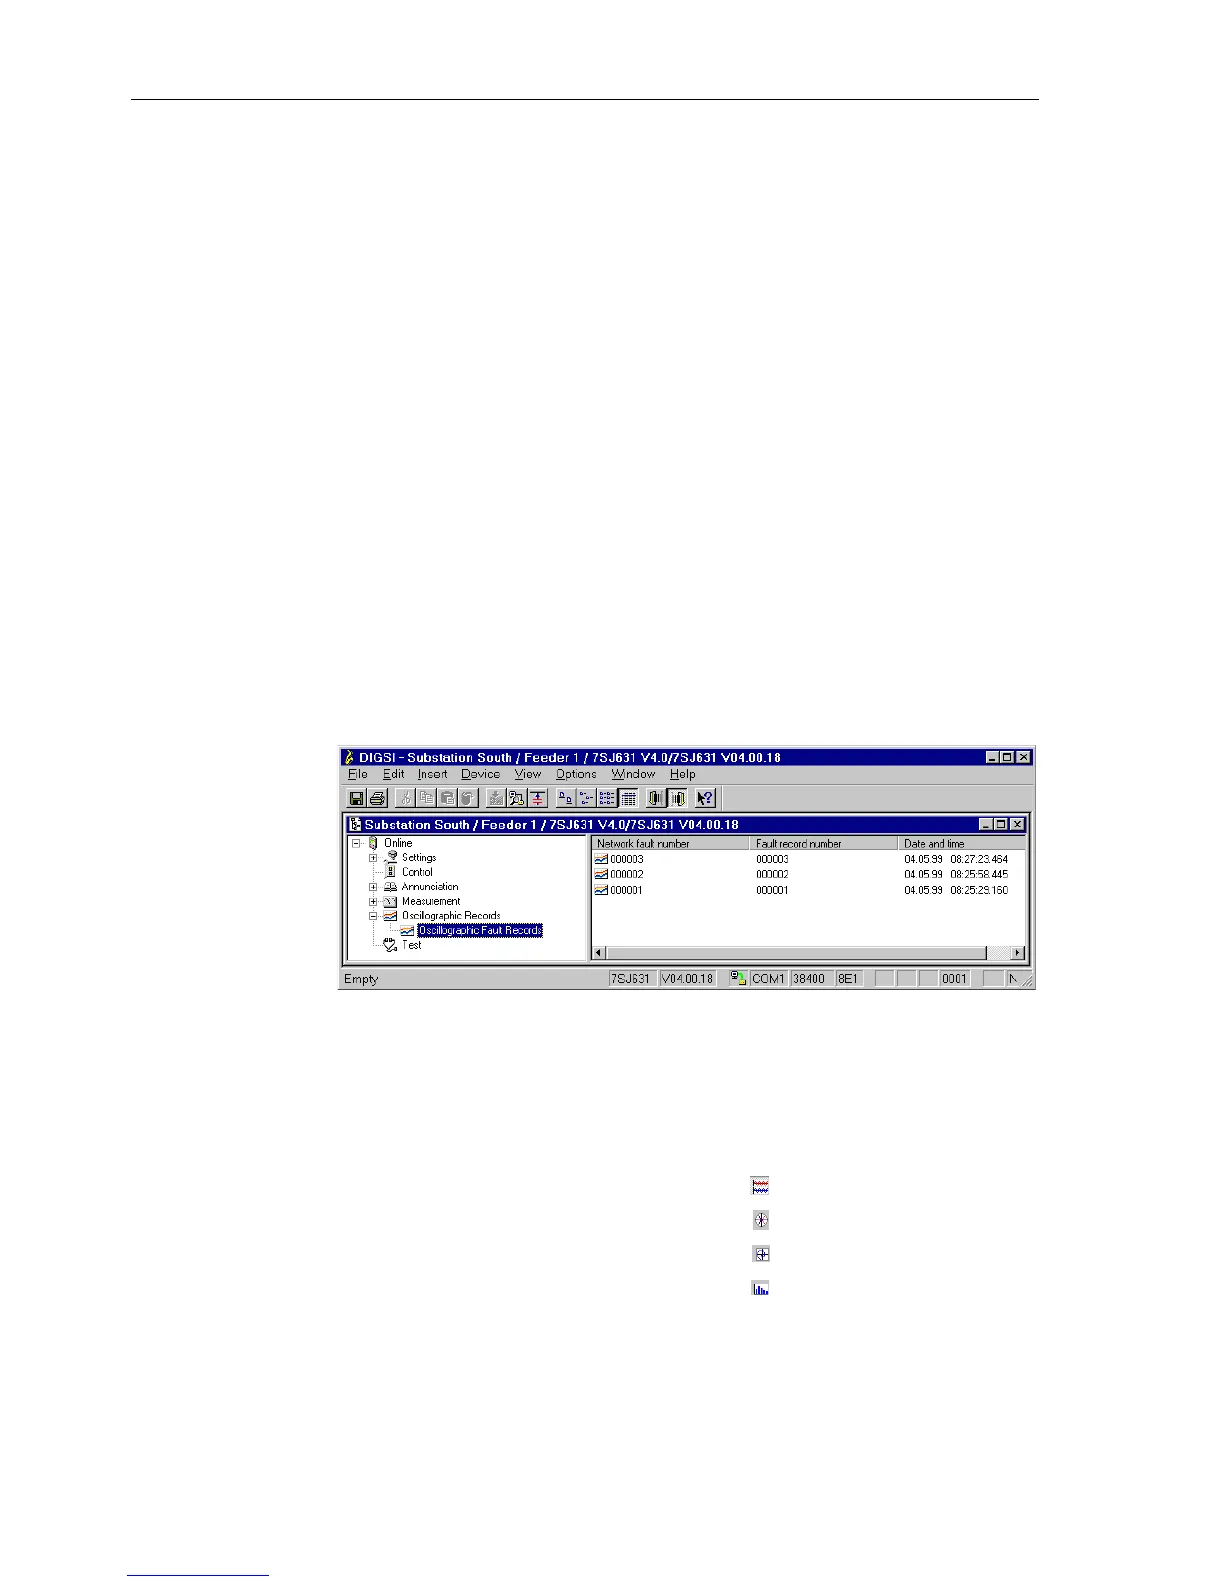
Double click on
Oscillographic Records (Figure 7-26). The folders listed in the
right window show an overview of oscillographic records. The records are identified
with a network fault number, a fault record number, and the date and time.
By double clicking on an fault record in the list view in the right side of the window, one
of the above programs is opened, and the selected waveform data are loaded. (See
also DIGSI
®
4, Operating Handbook, order no. E50417–H1176–C097, Subsection
8.3.3).
Figure 7-26 Retrieval of fault records in DIGSI
®
4 – example
SIGRA 4 provides support in the analysis of faults on the power system. The program
graphically prepares the data recorded during a fault, and calculates additional meas-
urement quantities, such as impedances or rms values.
The quantities can be represented in these views:
• Time signals
• Phasor diagrams
• Locus diagrams
• Harmonics
Selection takes place using the menu bar (
View), or clicking in the symbol bar above
the represented switching fields. Figure 7-27 shows all four views simultaneously.
:
 Loading...