5.4.7. Charts customization
In the Application Settings Program configuration -> Graph setup -> ...
This section equally applies to the individual appearance settings of speed, voltage, current, PWM duty factor, temperature, and other
parameter charts, which can be displayed in the XILab application.
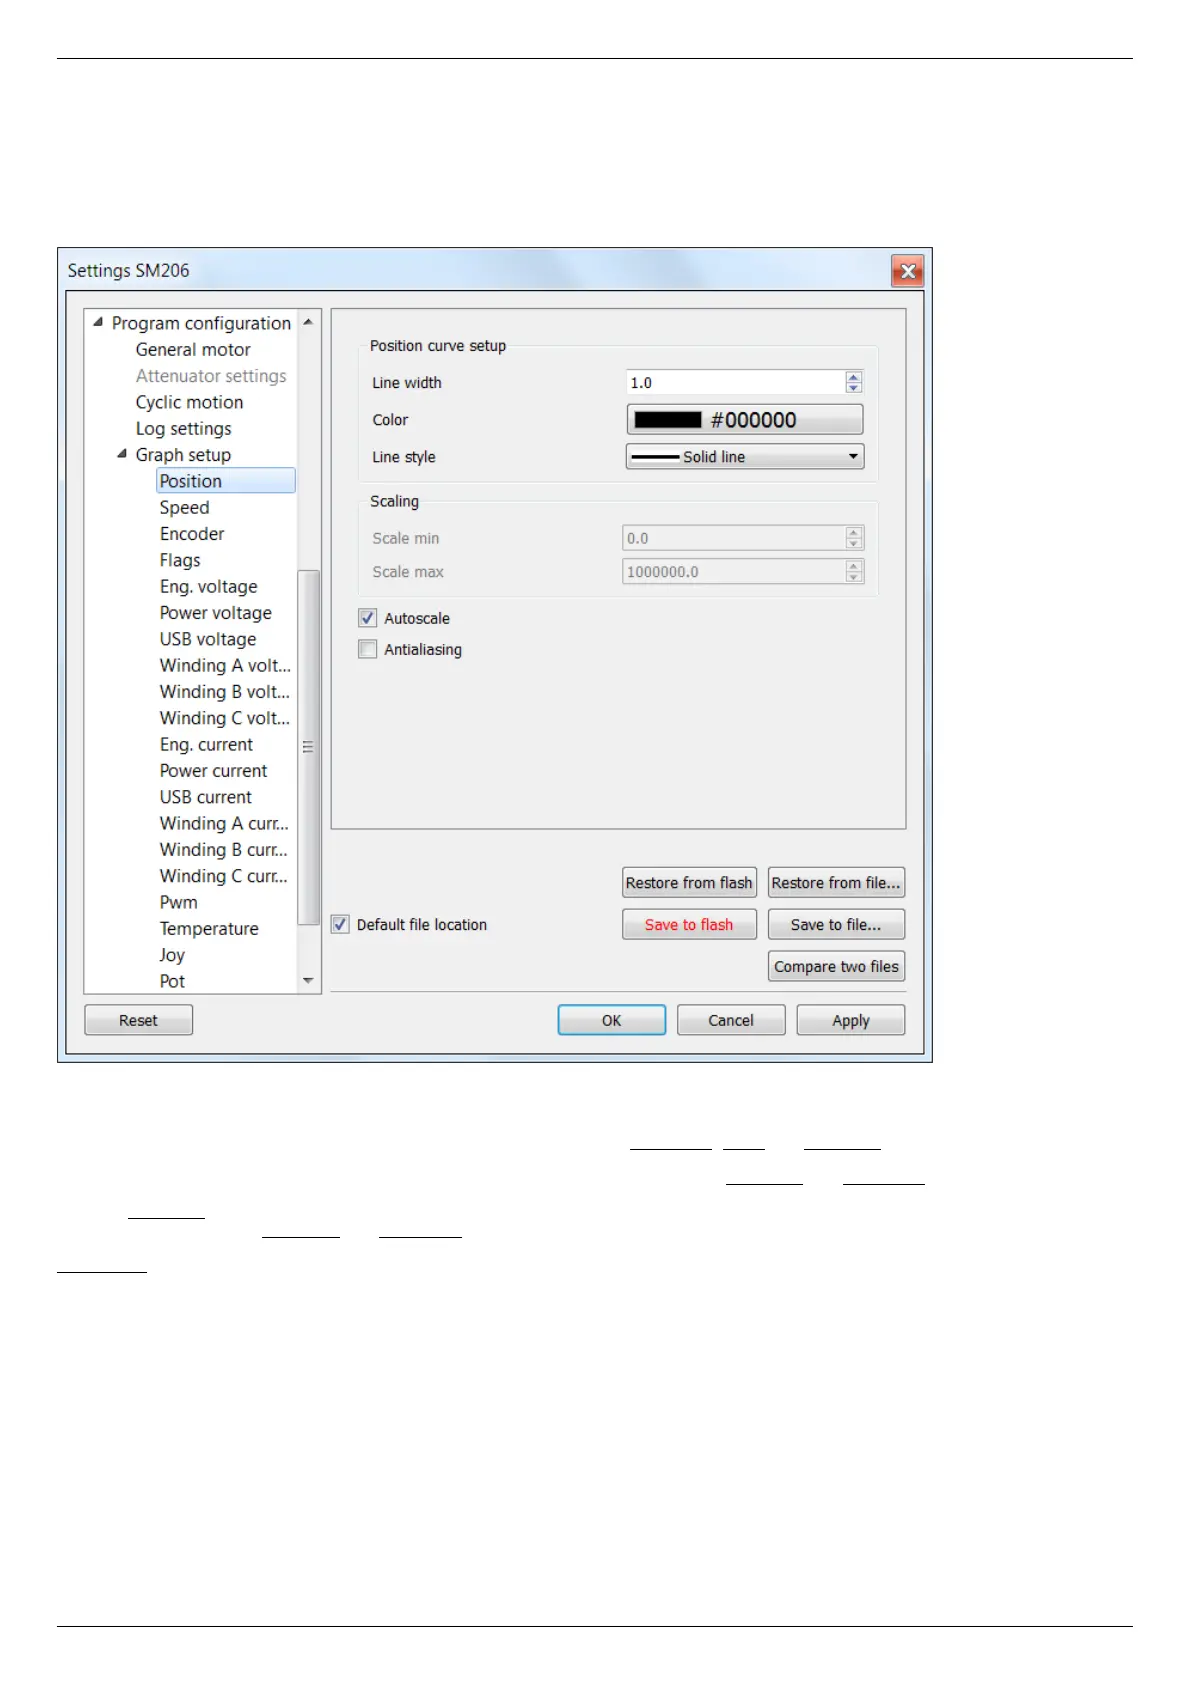
Charts customization on the example of the position chart tab
Charts display settings include line style and chart vertical axis scale adjustment.
Position curve setup group changes curve parameters. It includes the Line width, Color and Line style.
Scaling group changes curve display range on the vertical axis by setting values in Scale min and Scale max.
Checked Autoscale flag results in auto-scaling of the scale limits in accordance with the change limits of the variable on the axis Y. In
this case, the parameters Scale min and Scale max are ignored.
Antialiasing flag enables chart lines smoothing, which provides the possibility to achieve a higher-quality display, but it slows a little the
chart drawing process.