333
to 0.0 Hz and the Curs2 Pos to 125 kHz.
The cursor readout now indicates the frequency span set in
step 9.
13. Use the multipurpose knobs or keypad to set the Curs2 Pos
to 62.5 kHz.
The cursor readout now indicates the center frequency set in step
9.
Measure the test results
14. Use the multipurpose knobs or keypad to set the Curs1 Pos
to 3.0 kHz and the Curs2 Pos to 11.0 kHz.
In this example, the cursors are now on the third and
eleventh harmonic of the probe compensation signal. Read
the frequencies from the cursor readouts.
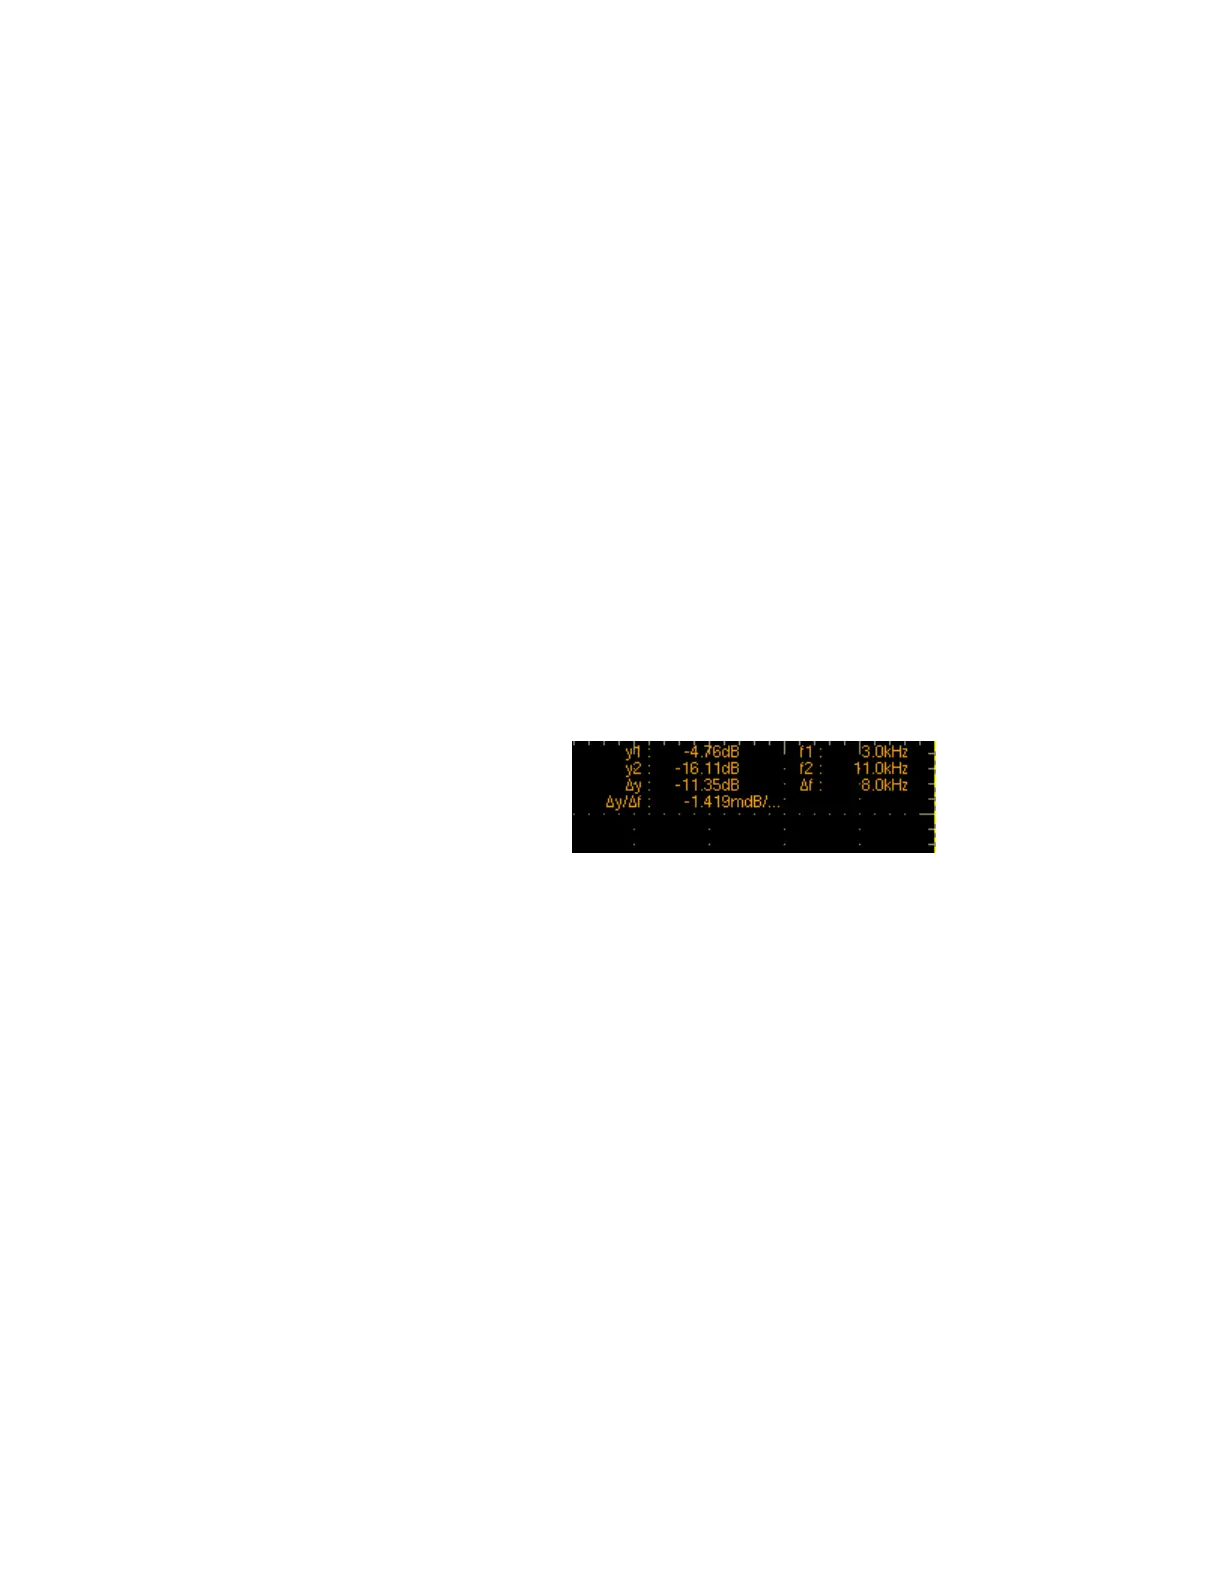
15. Click the Cursor Type Waveform button. Click the Cursor 2
button and then the Math 1 button.
Now in addition to the frequency at the cursor locations, the
cursor readout displays the amplitude at the cursor locations. The
readout also displays the difference in frequency and amplitude
between the cursor locations as shown below.
Defining a Spectral Math Waveform
Use this procedure to define a spectral math waveform. First ensure that the sources you use exist.
Channel sources should be acquiring or have acquired data. These sources do not have to be
displayed to be used.
Prerequisites
1. All sources that you will use in your math waveform
must be available.
Open the Spectral
Analysis Setup control
window
2. From the toolbar, click the Math button to open the Math
Setup control window.
3. Click Spectral Analysis Setup to open the Spectral
Analysis Setup control window.
Select a spectral
waveform
4. Click Mathn, and select the math waveform that you want to
create from the list.
5. Click Magnitude to create a magnitude spectral waveform
or Phase to create a phase spectral waveform. If you want
an averaged spectral waveform, click Average, and click
Avgs to set the number of averages. See the step Apply
 Loading...