Test Records
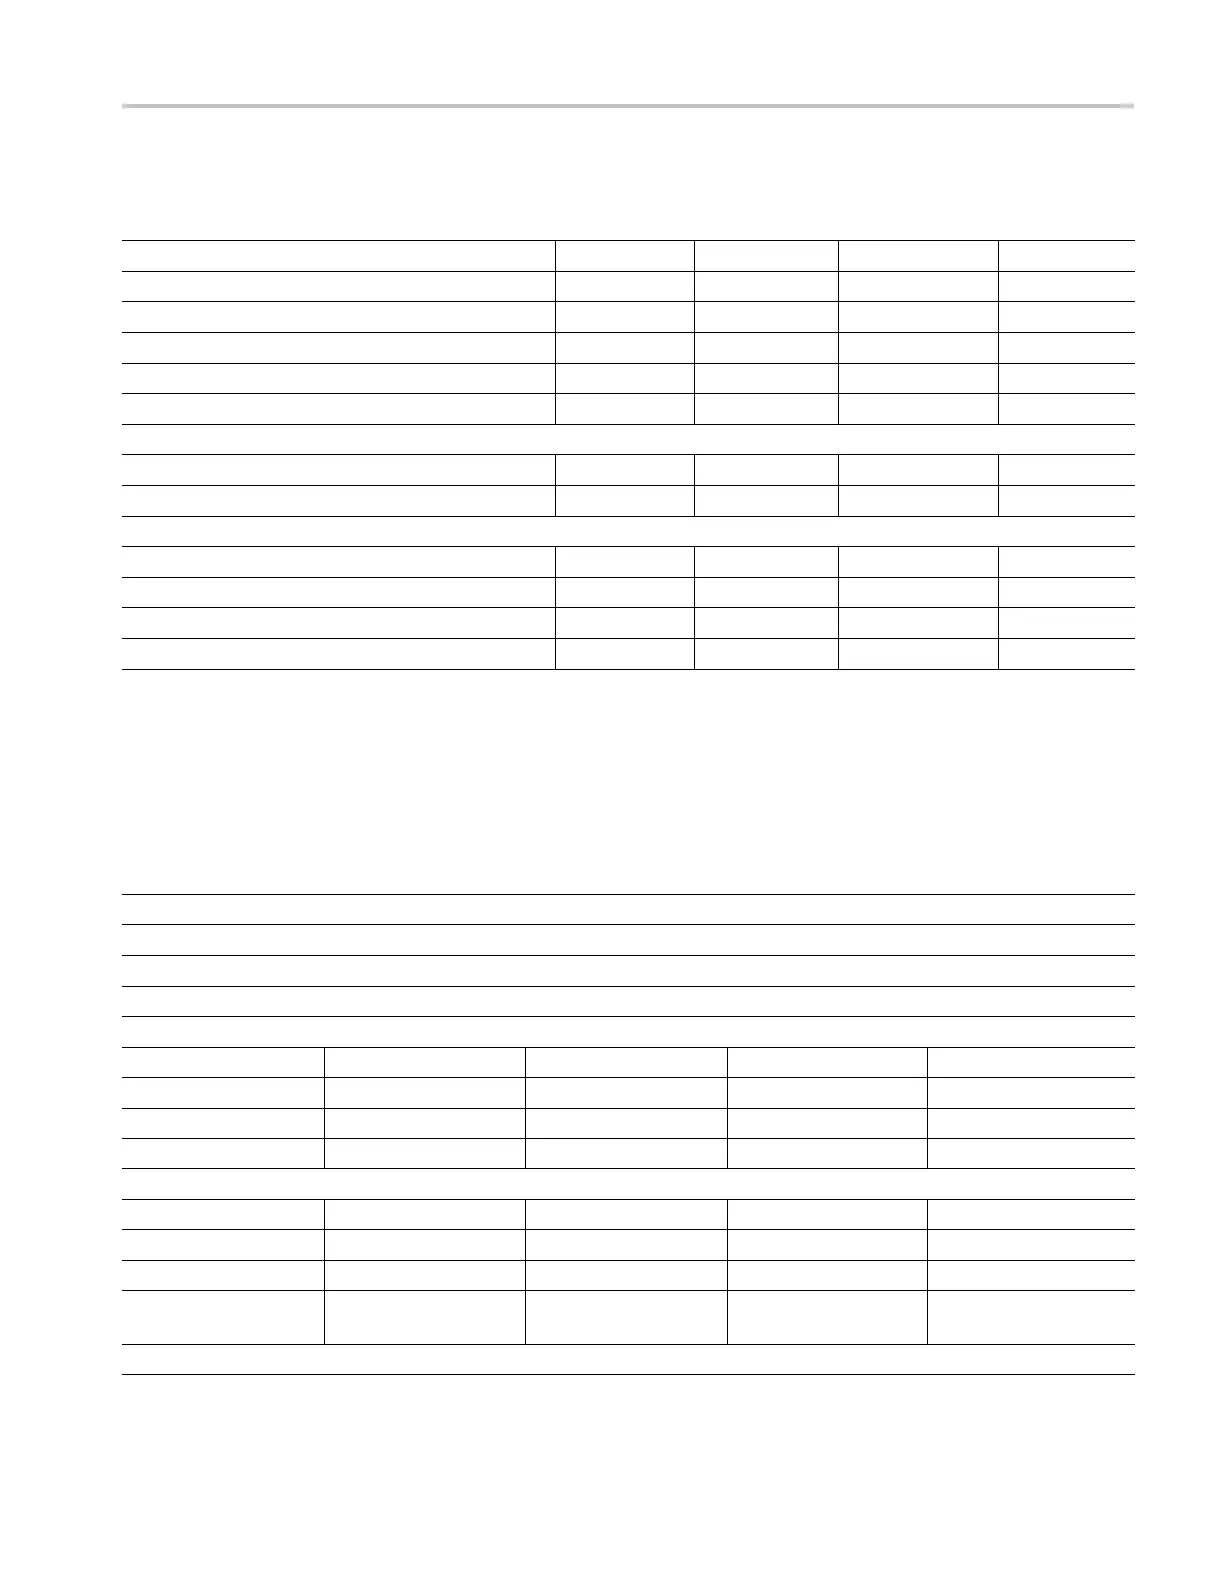
Table 56: WFM6120, WFM7000, and WFM7120 Waveform Monitor Video Performance Test Record (cont.)
Performance Test Minimum Incoming Outgo ing Maximum
Recovered Sine Wave (Opt EYE and PHY)
Pass
RecoveredSineWave(OptJIT)
Pass
LT C Decoding Functionality
Pass
Eye Gain
SDI A Input
760 mV 840 mV
SDI B Input
760 mV 840 mV
Reference Clock Amplitude and Frequency
Clock Amplitude
Pass
Clock Frequency
Pass
Eye Signal Bandwidth
SDI A 2.5 GHz Response
SDI A Minimum Response
SDI B 2.5 GHz Response
SDI B Minimum Response
Test Record - All Instruments (SD)
The following test record covers tests of SD functionality. These tests are valid
for all instruments with SD.
Table 57: WFM6120, WFM7020, and WFM7120 Waveform Monitor Video Performance Test Record
Instrument S erial Number: Certificate Number:
Temperature:
RH %:
Date of Calibration:
Technician:
Performance Test Minimum Incoming Outgoing Maximum
SD SDI Input Level Low and High
Input A, Low Level 720 mV
Input A, High Level 880 mV
Input B, Low Level 720 mV
Input B, High Level 880 mV
SD SDI Input Equalization R ange and EDH
EDH Pass
Input A 23 dB
Input B 23 dB
SD P ixMon Multiburst
Frequency R esponse
–0.92 dB (–10%) +0.82 dB (+10%)
Analog Pixmon Gain and Offset
Waveform Monitors Specifications and P erformance Verification 47
 Loading...