73
The protocol header provides the following information for each single measurement: Manufacturer,
device no., data set no., test date and time. This information cannot be arbitrarily modified by the user.
Remarks may appear as well, if they have been specified by text entry mode. GPS and UTM coordinates
stored by the measuring computer may be erased or modified by shifting the red dot in the Google
®
Maps
®
map. If data have been recorded by smartphone APP ‘TERRATEST’ and loaded together with their *.JSON
files, they are read together with the data entered by the user at the smartphone. For entry of order speci-
fic information, refer to chapter ‘Edit/Save Protocol’.
The measuring results table lists the three detected single settlements in mm, the average of the three sin-
gle settlements in mm, the Evd value in MN/mm
2
, the difference to the required Evd value (this parame-
ter has to be entered manually), the s/v value (relation settlement/speed) in ms, as well as the manual entry
of the required Ev2 value.
At the left below the table, the three settlement curves are displayed in different colors s4 = blue, s5 = red,
s6 = yellow). Duration of measurement, maximum settlement and trend become obvious from the curve
progression. In the case of compacted soil, the three curves usually appear close to each other.
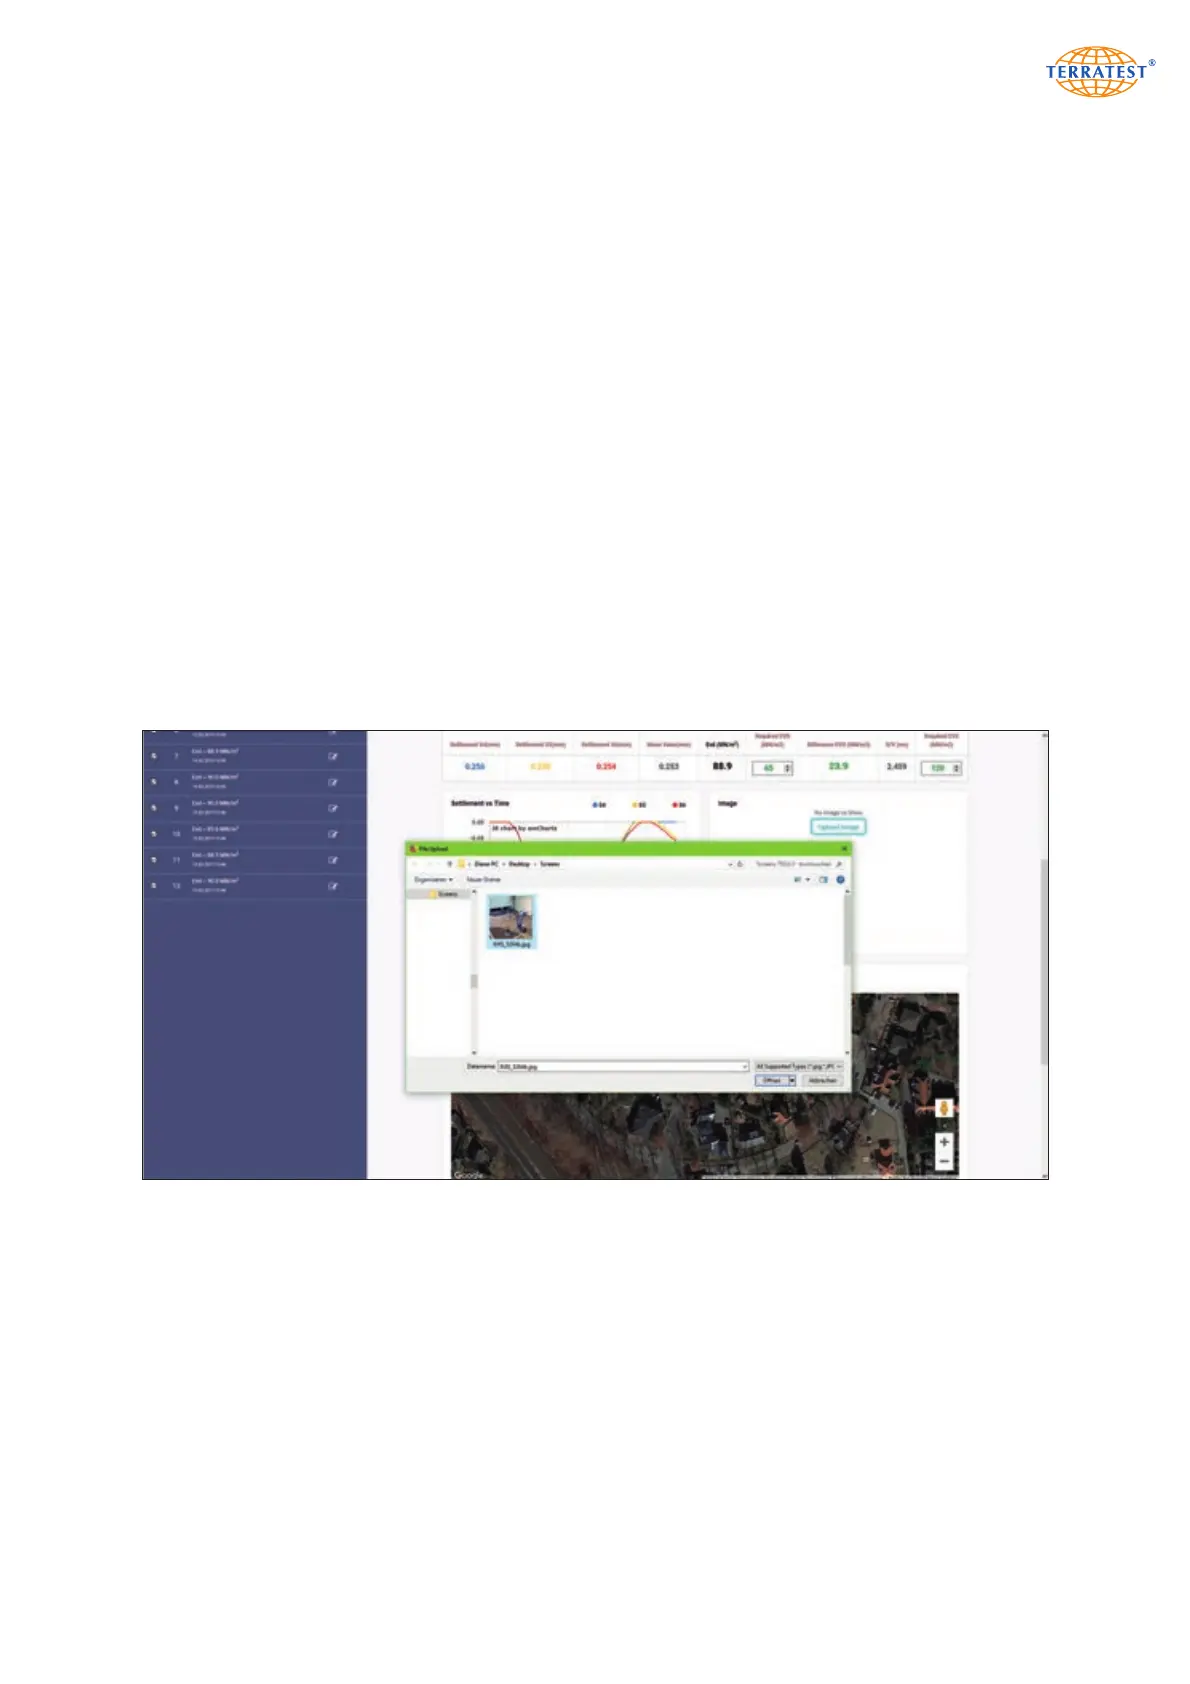
At the right side of the table, a photograph of the measuring point may be entered by the user. It is stored
in single protocol together with the measuring data.
If Internet connection has been activated and GPS coordinates are available, a Google
®
Maps
®
map of the
measuring point is meanwhile automatically stored in single protocol as well.
Below the Google
®
Maps
®
presentation, the user may enter his name and insert a facsimile of his signature
by upload.
For each test protocol, a photograph of the measuring point may be loaded. It will be stored together with
the measurement itself.
 Loading...