Chapter 6: Sequence Graphing 103
Defining and Displaying Sequence Graphs
TI-84 Plus Graphing Mode Similarities
The steps for defining a sequence graph are similar to the steps for defining a function graph.
Chapter 6 assumes that you are familiar with Chapter 3: Function Graphing. Chapter 6 details
aspects of sequence graphing that differ from function graphing.
Setting Sequence Graphing Mode
To display the mode screen, press z. To graph sequence functions, you must select Seq
graphing mode before you enter window variables and before you enter sequence functions.
Sequence graphs automatically plot in Simul mode, regardless of the current plotting-order mode
setting.
TI-84 Plus Sequence Functions u, v, and w
The TI-84 Plus has three sequence functions that you can enter from the keyboard: u, v, and w.
They are second functions of the ¬, −, and ® keys. Press y
[u] to enter u, for example.
You can define sequence functions in terms of:
• The independent variable
n
• The previous term in the sequence function, such as u(nN1)
• The term that precedes the previous term in the sequence function, such as u(nN2)
• The previous term or the term that precedes the previous term in another sequence function,
such as
u(nN1) or u(nN2) referenced in the sequence v(n).
Note: Statements in this chapter about u(n) are also true for v(n) and w(n); statements about u(nN1)
are also true for
v(nN1) and w(nN1); statements about u(nN2) are also true for v(nN2) and w(nN2).
Displaying the Sequence Y= Editor
After selecting Seq mode, press o to display the sequence Y= editor.
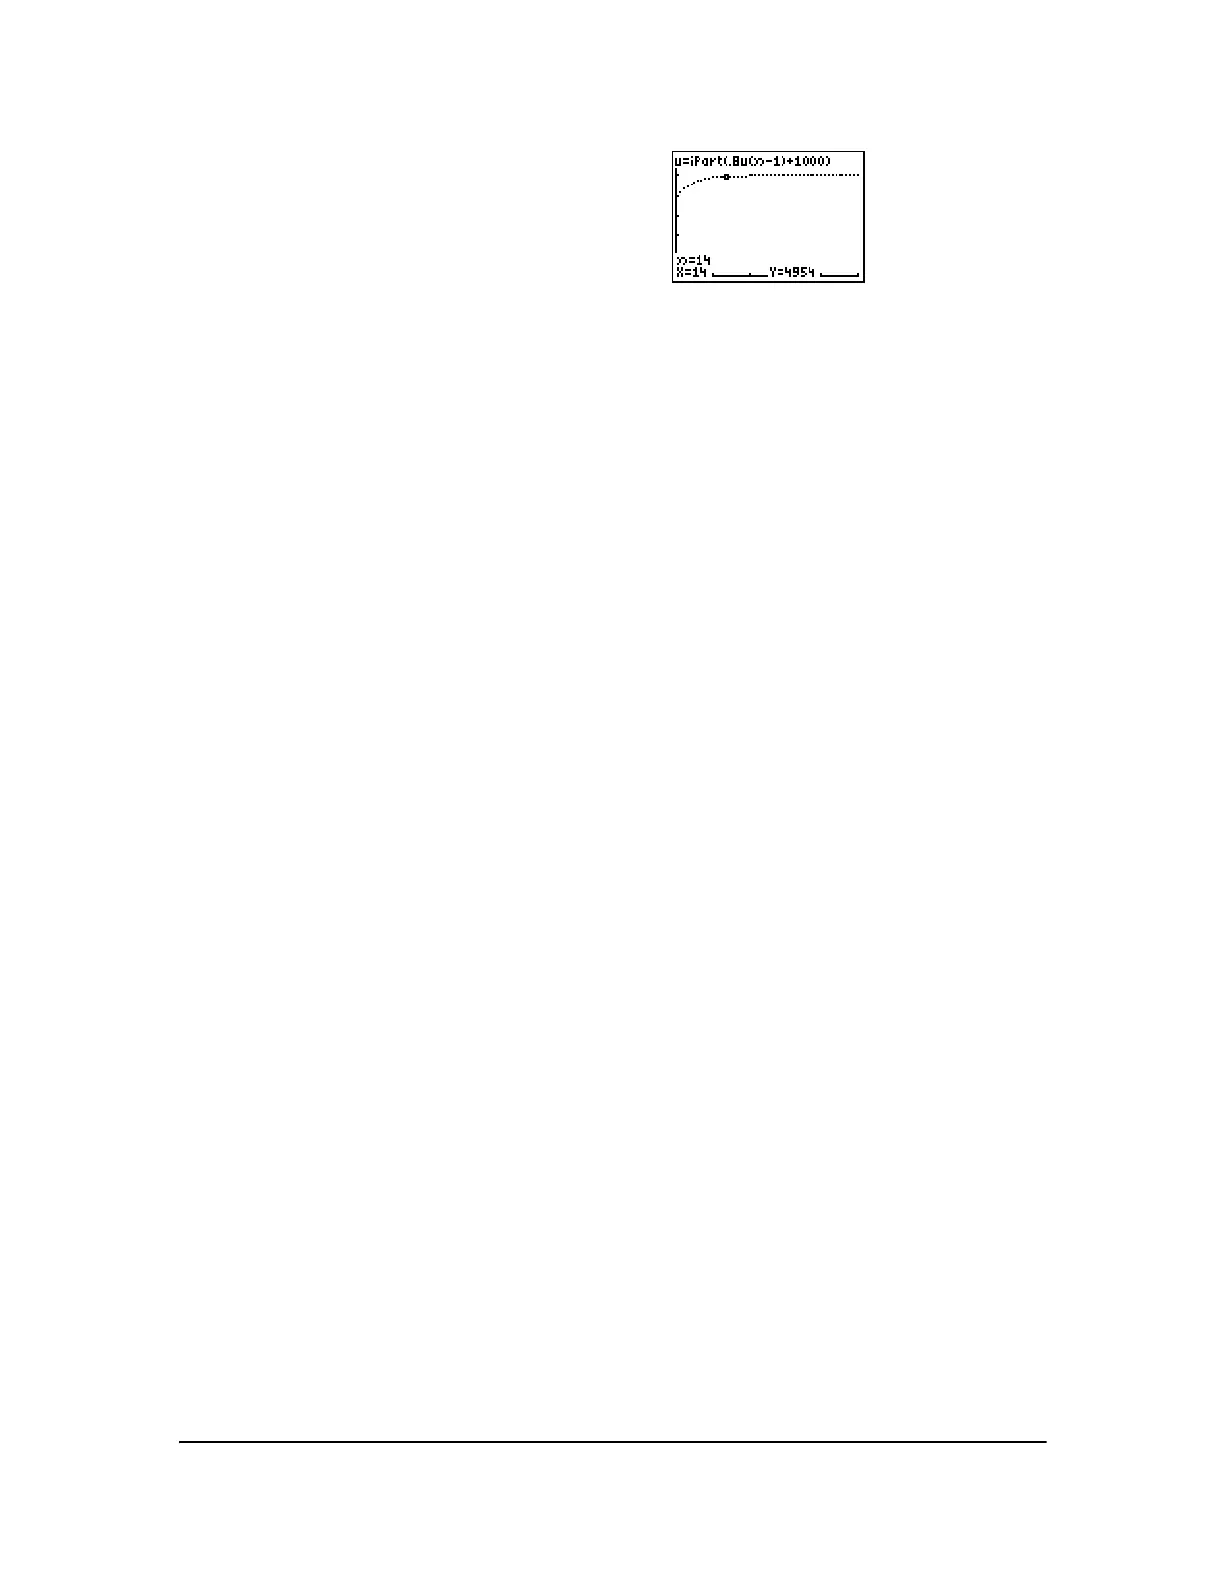
6. Press r. Tracing begins at
nMin (the start of
the forestry plan). Press ~ to trace the sequence
year by year. The sequence is displayed at the top
of the screen. The values for
n (number of years),
X (X=n, because n is plotted on the x-axis), and Y
(tree count) are displayed at the bottom. When will
the forest stabilize? With how many trees?

 Loading...


