Chapter 17: Activities 310
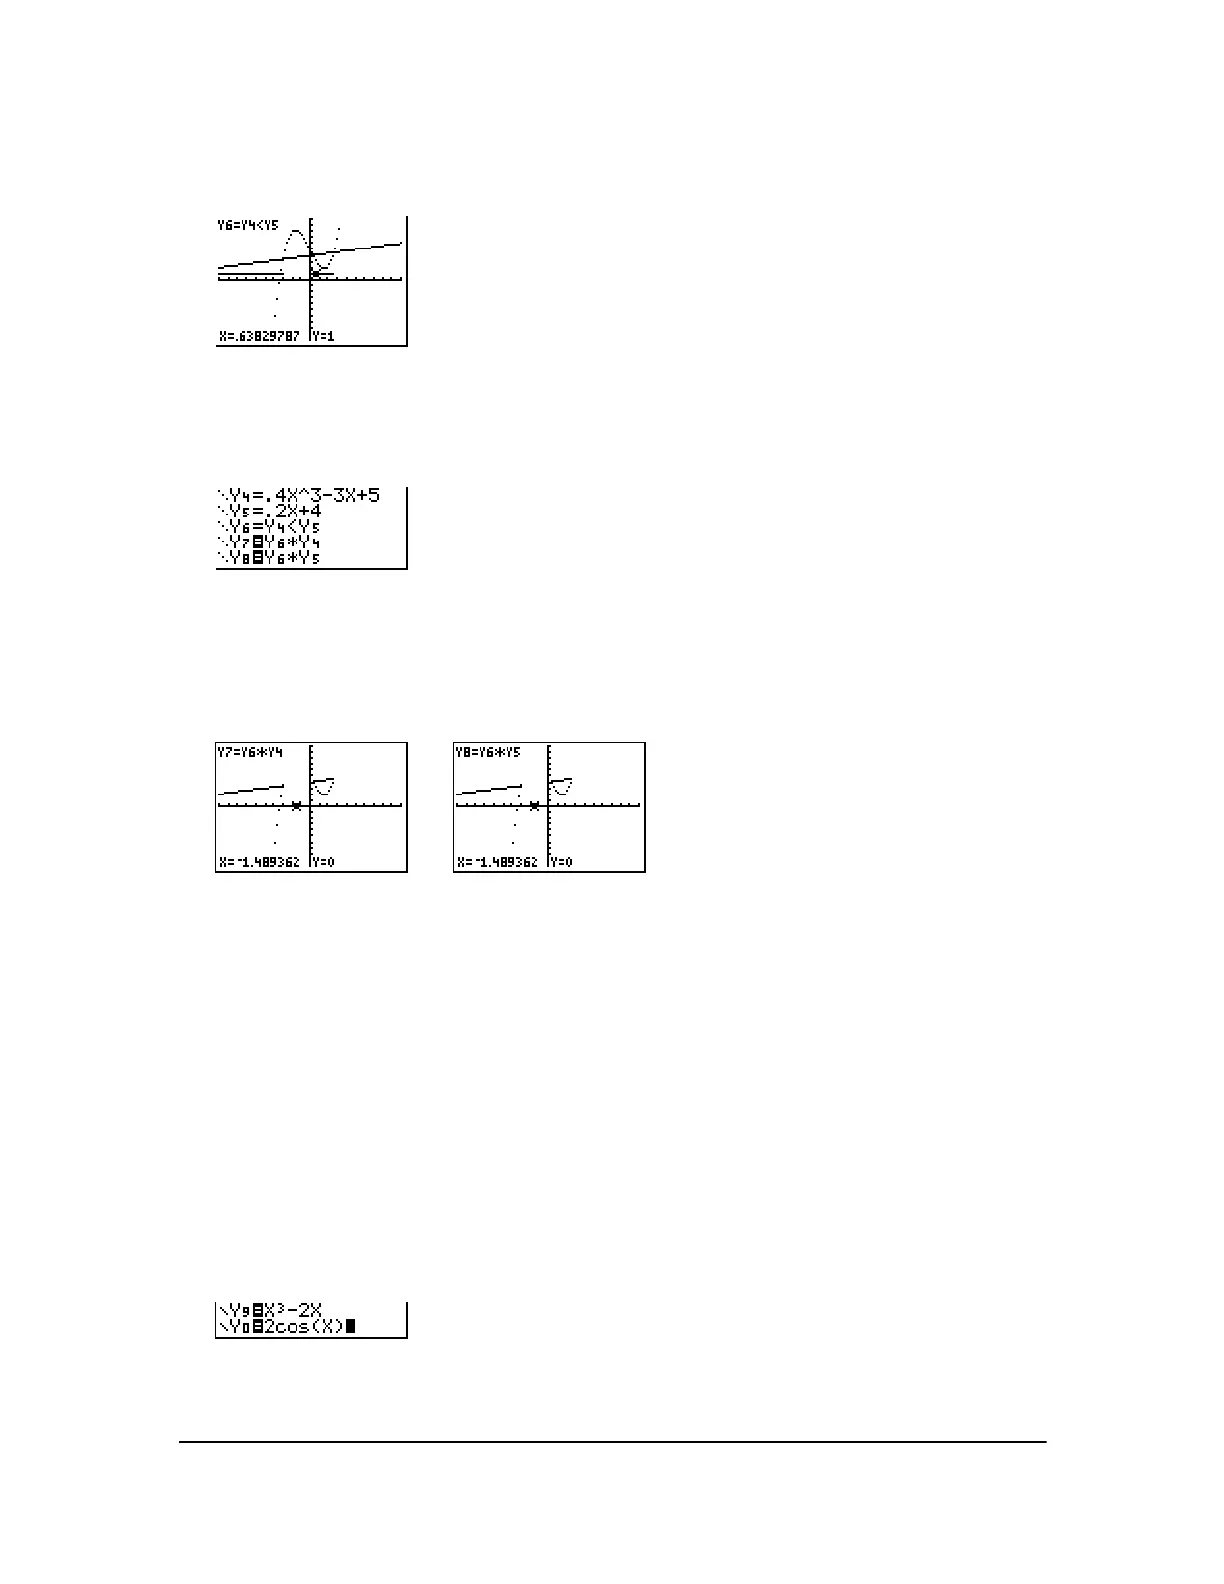
5. Press r † † to move to Y6. Then press | and ~ to trace the inequality, observing the
value of
Y.
When you trace, you can see that Y=1 indicates that Y4<Y5 is true and that Y=0 indicates that
Y4<Y5 is false.
6. Press o. Turn off Y4, Y5, and Y6. Enter equations to graph only the inequality.
7. Press r.
Notice that the values of Y7 and Y8 are zero where the inequality is false. You only see the
intervals of the graph where Y4<Y5 because intervals that are false are multiplied by 0
(Y6
†Y4 and Y6†Y5)
Solving a System of Nonlinear Equations
Problem
Using a graph, solve the equation x
3
N2x=2cos(x). Stated another way, solve the system of two
equations and two unknowns: y = x
3
N2x and y = 2cos(x). Use ZOOM factors to control the decimal
places displayed on the graph and use y /
5:intersect to find an approximate solution.
Procedure
1. Press z. Select the default mode settings. Press o. Turn off all functions and stat plots.
Enter the functions.

 Loading...


