Chapter 6: Sequence Graphing 109
• When Time axes format is selected,
value displays Y (the u(n) value) for a specified n value.
• When Web axes format is selected,
value draws the web and displays Y (the u(n) value) for a
specified
n value.
• When
uv, vw, or uw axes format is selected, value displays X and Y according to the axes
format setting. For example, for
uv axes format, X represents u(n) and Y represents v(n).
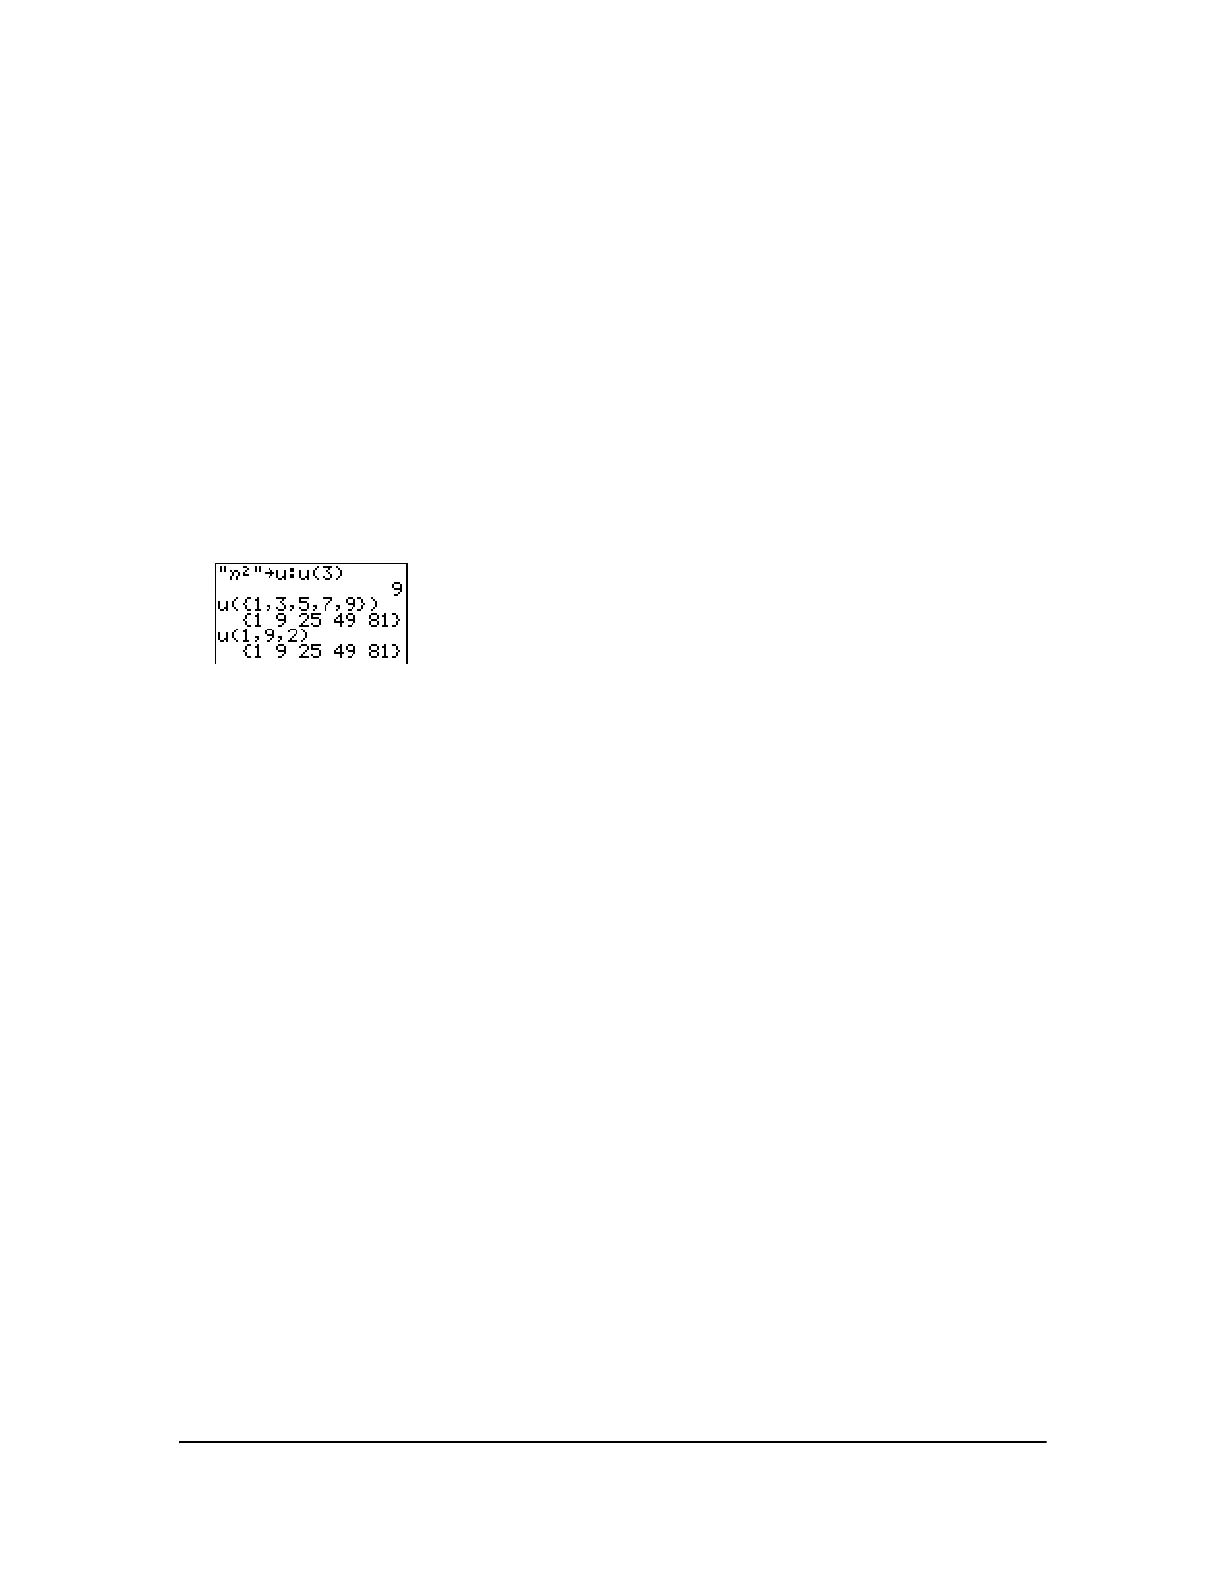
Evaluating u, v, and w
To enter the sequence names
u, v, or w, press y [u], y [v], or y [w]. You can evaluate these
names in any of three ways.
• Calculate the
nth value in a sequence.
• Calculate a list of values in a sequence.
• Generate a sequence with
u(nstart,nstop[,nstep]). nstep is optional; default is 1.
Graphing Web Plots
Graphing a Web Plot
To select Web axes format, press y . ~ Í. A web plot graphs
u(n) versus u(nN1),
which you can use to study long-term behavior (convergence, divergence, or oscillation) of a
recursive sequence. You can see how the sequence may change behavior as its initial value
changes.
Valid Functions for Web Plots
When Web axes format is selected, a sequence will not graph properly or will generate an error.
• It must be recursive with only one recursion level (
u(nN1) but not u(nN2)).
• It cannot reference
n directly.
• It cannot reference any defined sequence except itself.
Displaying the Graph Screen
In Web format, press s to display the graph screen. The TI-84 Plus:
•Draws a
y=x reference line in AxesOn format.
• Plots the selected sequences with
u(nN1) as the independent variable.

 Loading...


