Previews 65
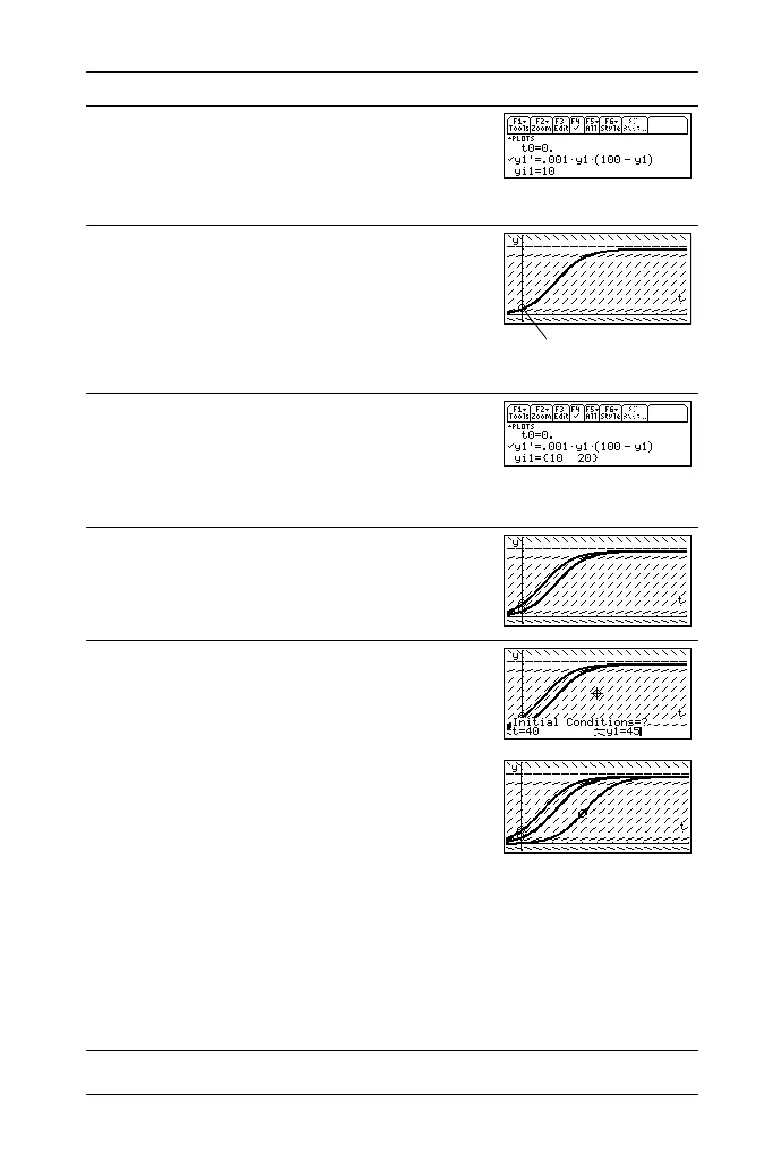
6. Return to the Y= Editor and enter an initial
condition:
yi1=10
Press 8 # ¸ 10 ¸
7. Return to the Graph screen.
Initial conditions entered in the
Y= Editor
always occur at t
0
. The graph begins at the
initial condition and plots to the right. Then
it plots to the left.
Press 8 %
8. Return to the Y= Editor and change yi1 to
enter two initial conditions as a list:
yi1={10,20}
Press 8 # C ¸ 2 [ 10 b 20 2 \
¸
9. Return to the Graph screen.
Press 8 %
10. To select an initial condition interactively,
press:
@2 Š
When prompted, enter t=40 and y1=45.
When selecting an initial condition
interactively, you can specify a value for t
other than the t
0
value entered in the
Y= Editor or Window Editor.
Instead of entering t and y1 after pressing
@2 Š
you can move the cursor to a point on the
screen and then press ¸.
You can use … to trace curves for initial
conditions specified in the Y= Editor.
However, you cannot trace the curve for an
initial condition selected interactively.
@2 Š 40 ¸ 45 ¸
Steps and keystrokes Display
The initial condition is
marked with a circle.

 Loading...


