66 Previews
Additional Graphing Topics
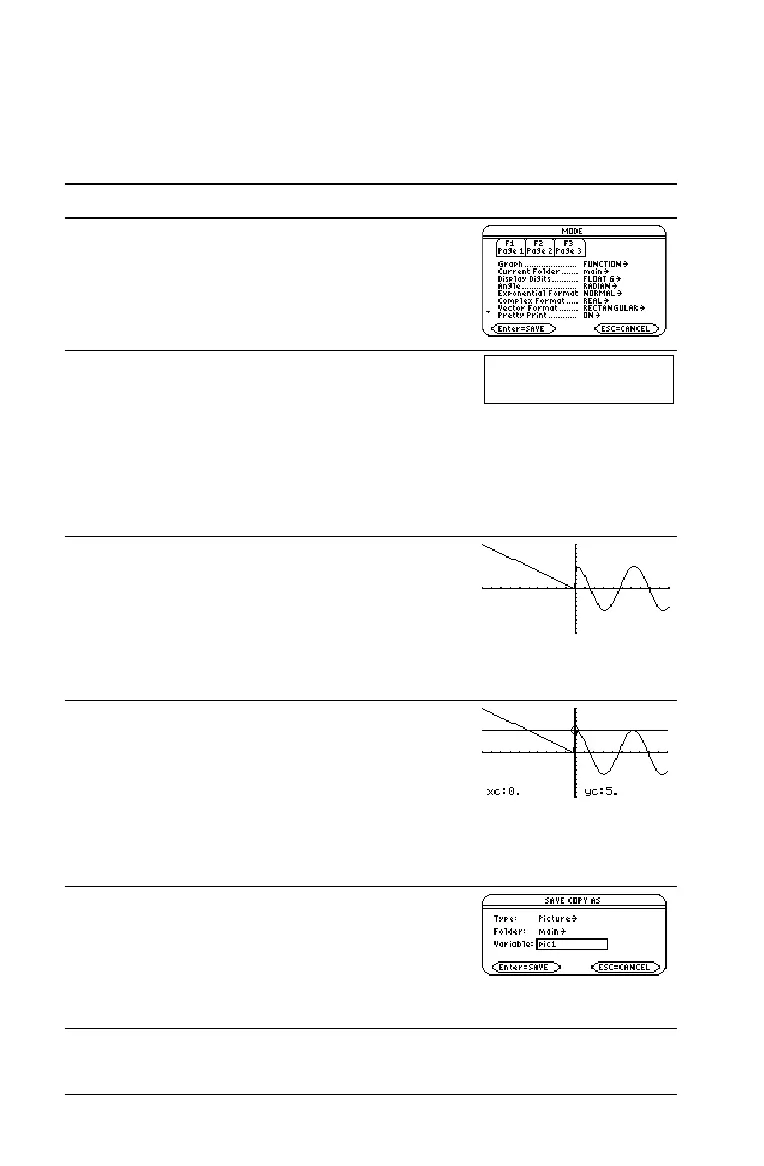
From the Home screen, graph the piecewise defined function: y = Lx
when x < 0 and y = 5 cos(x) when x ‚ 0. Draw a horizontal line across the
top of the cosine curve. Then save a picture of the displayed graph.
Steps and keystrokes Display
1. Display the MODE dialog box. For Graph
mode, select
FUNCTION. For Angle mode,
select RADIAN.
Press 3 B 1 D D D B 1 ¸
2. Display the Home screen. Use the
Graph
command and the
when function to specify
the piecewise defined function.
† 2 selects Graph from the Other toolbar
menu and automatically adds a space.
@ " † 2 2 ™ WHEN j c X
2 Â 0 b ? X b 5 p 2 X X d d
3. Execute the
Graph command, which
automatically displays the Graph screen.
The graph uses the current Window
variables, which are assumed to be their
standard values („ 6) for this example.
Press ¸
4. Draw a horizontal line across the top of the
cosine curve.
The calculator remains in “line” mode until
you select a different operation or press
N.
@2 ‰ 5 C (until the line is
positioned) ¸
5. Save a picture of the graph. Use PIC1 as the
variable name for the picture.
Be sure to set
Type = Picture. By default, it
is set to
GDB.
@, 2 B 2 D D PIC j 1 ¸ ¸
Graph when(x<0,Lx,
5…cos(x))

 Loading...


