58 Previews
Polar Graphing
The graph of the polar equation r1(q) = A sin B q forms the shape of a
rose. Graph the rose for A=8 and B=2.5. Then explore the appearance of
the rose for other values of A and B.
Steps and keystrokes Display
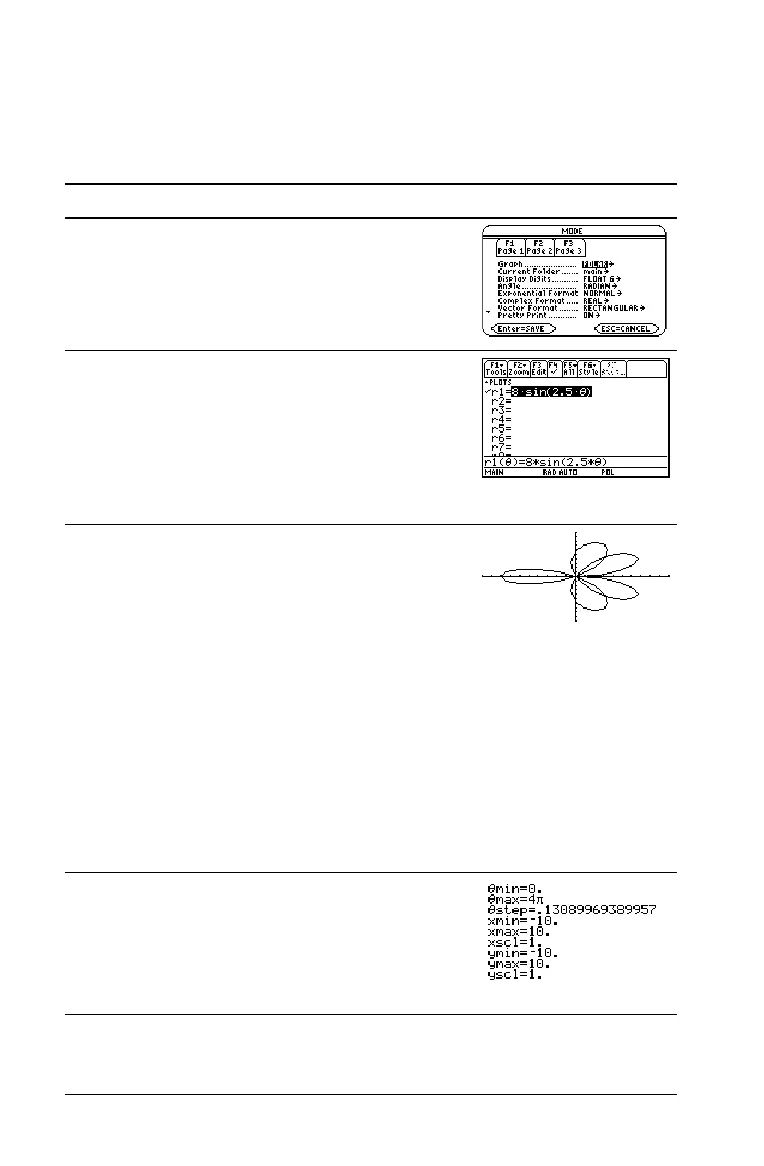
1. Display the MODE dialog box. For Graph
mode, select
POLAR. For Angle mode,
select RADIAN.
Press 3 B 3 D D D B 1 ¸
2. Display and clear the
Y= Editor. Then define
the polar equation r1(q) = A sin Bq.
Enter 8 and 2.5 for A and B, respectively.
@8 # , 8 ¸ ¸ 8 2 W 2.5
8 Ï d ¸
3. Select the
ZoomStd viewing window, which
graphs the equation.
• The graph shows only five rose petals.
– In the standard viewing window,
the Window variable qmax = 2p.
The remaining petals have q values
greater than 2p.
• The rose does not appear symmetrical.
– Both the x an y axes range from L10
to 10. However, this range is spread
over a longer distance along the x
axis than the y axis.
Press „ 6
4. Display the Window Editor, and change
qmax to 4p.
4p will be evaluated to a number when you
leave the Window Editor.
Press 8 $ D 4 2 T

 Loading...


