Activities 99
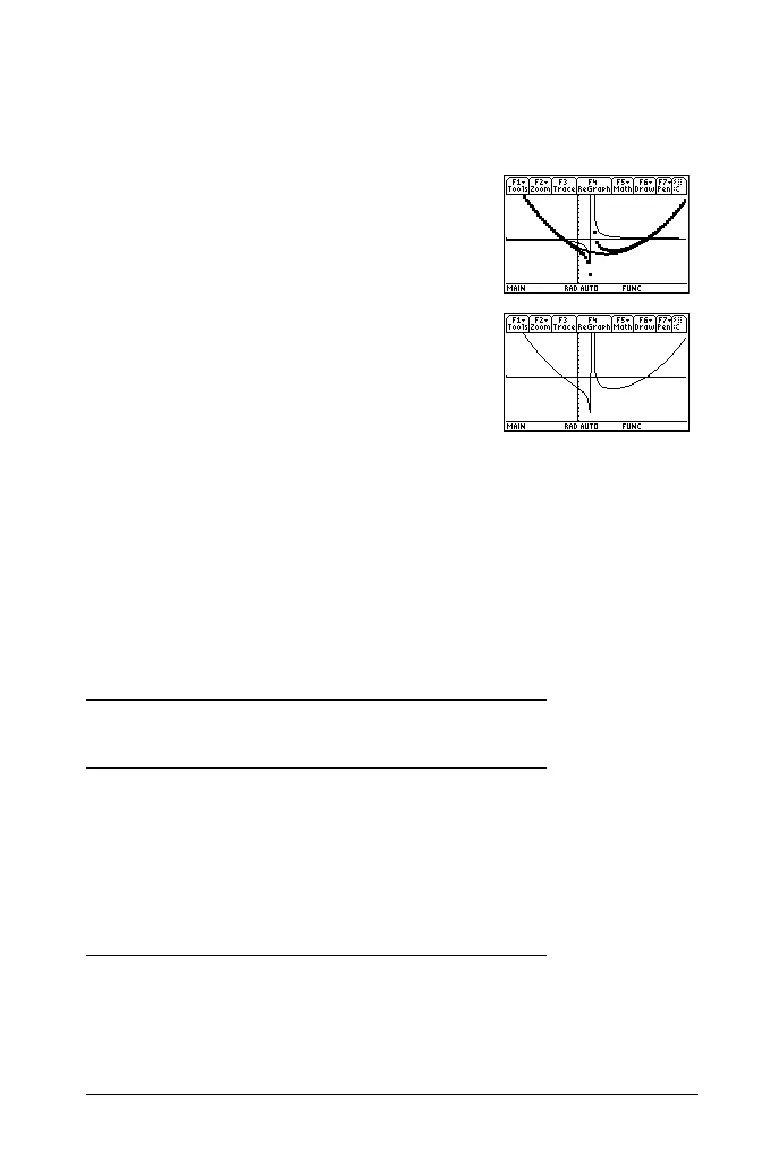
Observe that the global behavior of the f(x) function is basically
represented by the quadratic quotient y2(x). The rational expression is
basically a quadratic function as
x gets very large in both the positive and
negative directions.
Studying Statistics: Filtering Data by Categories
This activity provides a statistical study of the weights of high school
students using categories to filter the data.
Filtering Data by Categories
Each student is placed into one of eight categories depending on the
student’s sex and academic year (freshman, sophomore, junior, or senior).
The data (weight in pounds) and respective categories are entered in the
Data/Matrix Editor.
The lower graph is
y3(x)=f(x) graphed
separately using the line style.
Table 1: Category vs. Description
Category (C2) Academic Year and Sex
1
2
3
4
5
6
7
8
Freshman boys
Freshman girls
Sophomore boys
Sophomore girls
Junior boys
Junior girls
Senior boys
Senior girls

 Loading...


