100 Activities
Perform the following steps to compare the weight of high school
students to their year in school.
Table 2: C1 (weight of each student in pounds) vs. C2 (category)
C1 C2 C1 C2 C1 C2 C1 C2
110
125
105
120
140
85
80
90
80
95
1
1
1
1
1
2
2
2
2
2
115
135
110
130
150
90
95
85
100
95
3
3
3
3
3
4
4
4
4
4
130
145
140
145
165
100
105
115
110
120
5
5
5
5
5
6
6
6
6
6
145
160
165
170
190
110
115
125
120
125
7
7
7
7
7
8
8
8
8
8
1. Start the Data/Matrix Editor, and create a
new Data variable named
students.
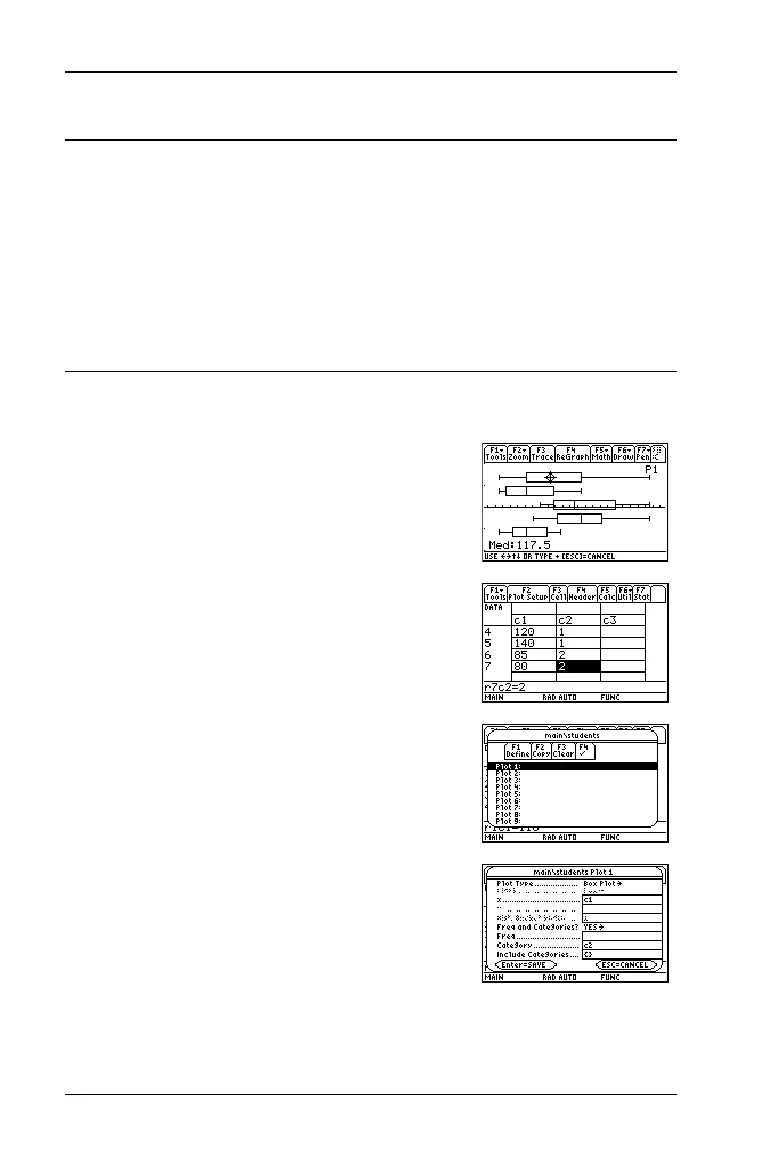
2. Enter the data and categories from Table 2
into columns
c1 and c2, respectively.
3. Open the „
Plot Setup toolbar menu.
Note: Set up several box plots to compare
different subsets of the entire data set.
4. Define the plot and filter parameters for
Plot 1 as shown in this screen.

 Loading...


