Previews 67
Tables
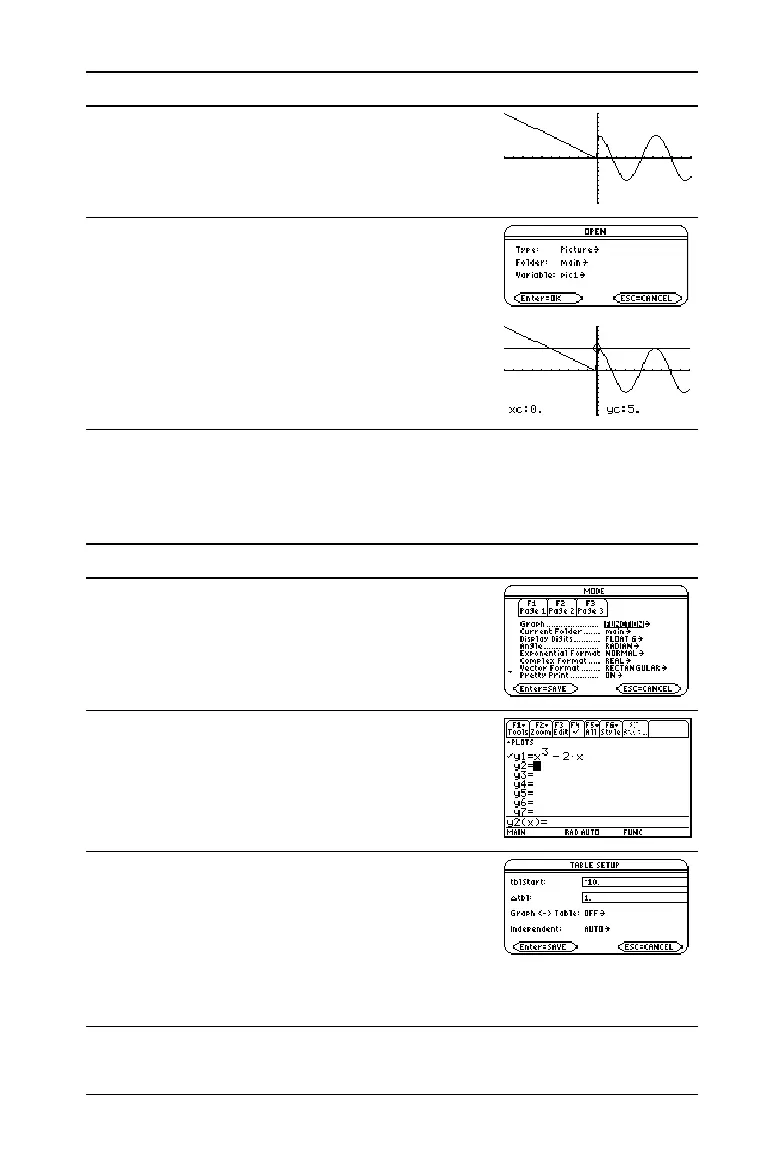
Evaluate the function y=x
3
N2x at each integer between M10 and 10. How
many sign changes are there, and where do they occur?
6. Clear the drawn horizontal line.
You can also press † to regraph.
@2 ˆ 1
7. Open the saved picture variable to redisplay
the graph with the line.
Be sure to set
Type = Picture. By default, it
is set to GDB.
Press , 1 B 2 (if not already shown, also
set Variable = pic1) ¸
Steps and keystrokes Display
1. Display the
MODE dialog box. For the
Graph mode, select FUNCTION.
Press 3 B 1 ¸
2. Display and clear the Y= Editor. Then define
y1(x) = x
3
N 2x.
Press 8 # , 8 ¸ ¸ X Z 3 | 2 X
¸
3. Set the table parameters to:
tblStart = M10
@tbl = 1
Graph < - > Table = OFF
Independent = AUTO
Press 8 & ? 10 D 1 D B 1 D B 1
¸
Steps and keystrokes Display

 Loading...


