Previews 55
Basic Function Graphing II
Graph a circle of radius 5, centered on the origin of the coordinate
system. View the circle using the standard viewing window (ZoomStd).
Then use ZoomSqr to adjust the viewing window.
9. Transfer the result to the Home screen, and
then display the Home screen.
@8 ? "
Steps and keystrokes Display
1. Display the MODE dialog box. For Graph
mode, select
FUNCTION.
Press 3 B 1 ¸
2. Display the Home screen. Then store the
radius, 5, in variable r.
@ " 5 9 j R ¸
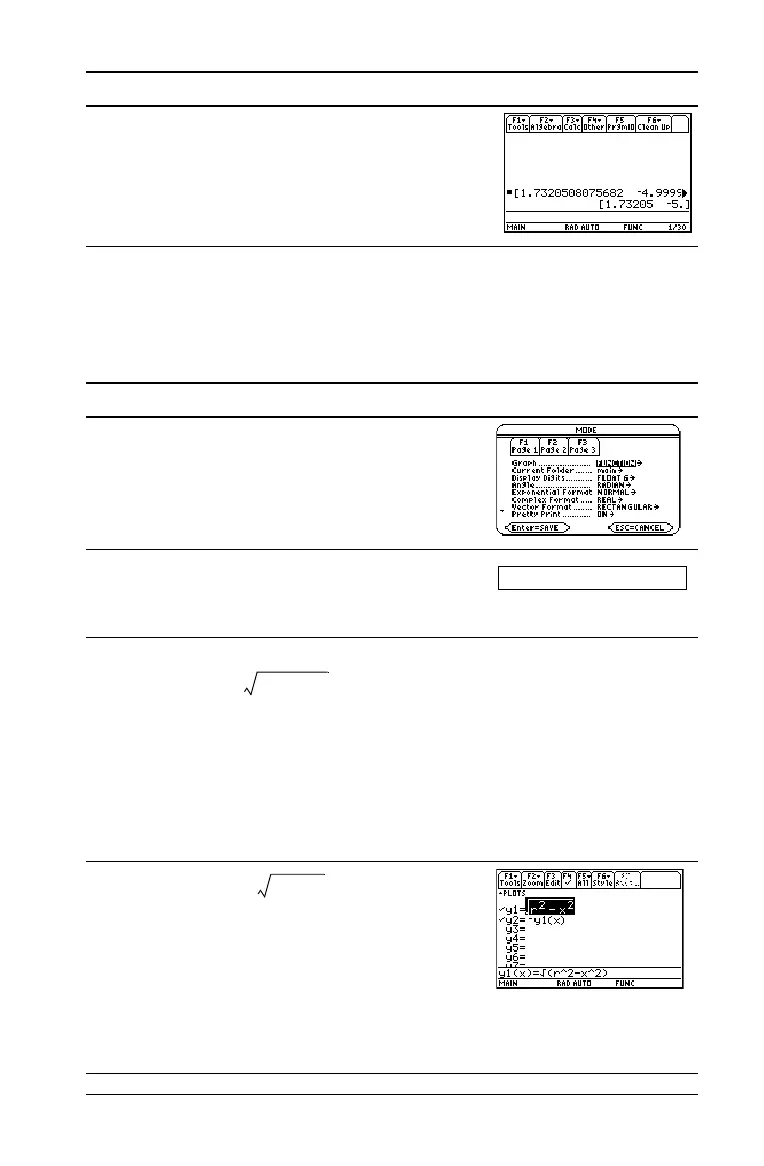
3. Display and clear the
Y= Editor. Then
define y1(x) = , the top half of a
circle.
In function graphing, you must define
separate functions for the top and bottom
halves of a circle.
@8 # , 8 ¸ ¸ 2 ] j R
Z 2 | X Z 2 d ¸
4. Define y2(x) = , the function for
the bottom half of the circle.
The bottom half is the negative of the top
half, so you can define y2(x) = Ly1(x).
Use the full function name
y1(x), not
simply y1.
Press ¸ ? Y 1 c X d ¸
Steps and keystrokes Display
5!r
r
2
x
2
–()
r
2
x
2
––

 Loading...


