56 Previews
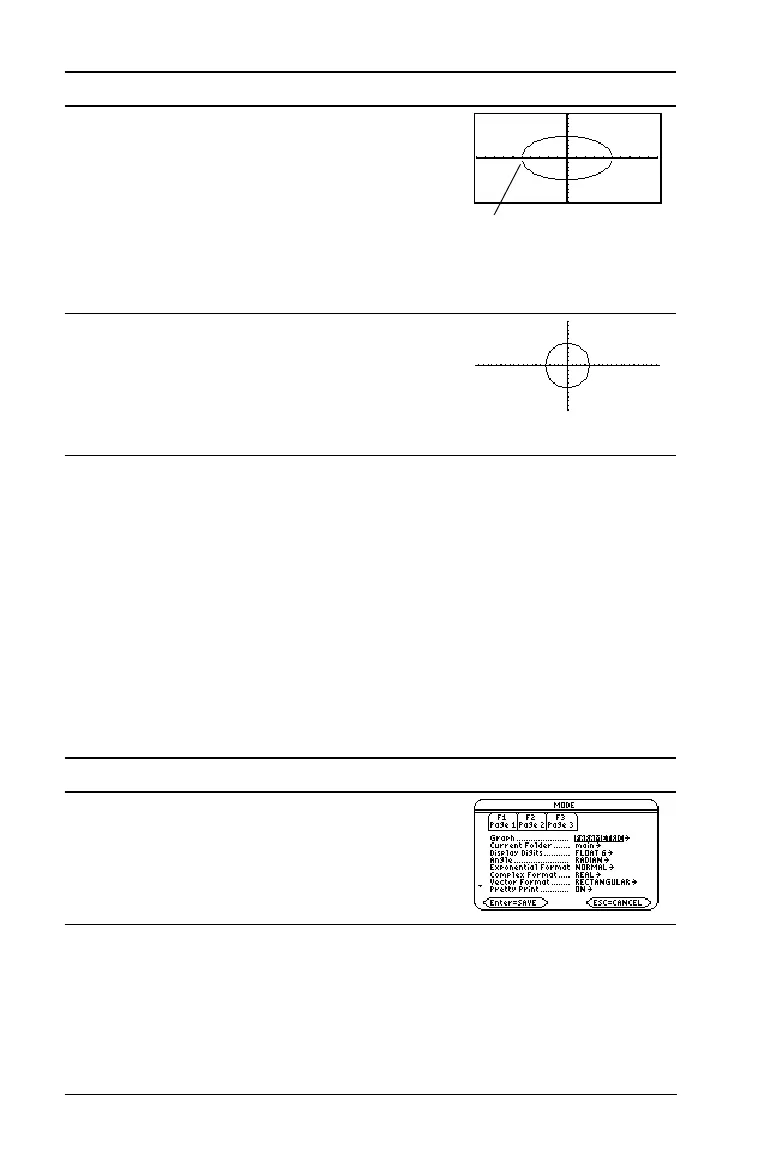
Note: There is a gap between the top and bottom halves of the circle
because each half is a separate function. The mathematical endpoints of
each half are (L5,0) and (5,0). Depending on the viewing window,
however, the plotted endpoints for each half may be slightly different
from their mathematical endpoints.
Parametric Graphing
Graph the parametric equations describing the path of a ball kicked at an
angle (q) of 60¡ with an initial velocity (v
0
) of 15 meters/sec. The gravity
constant g = 9.8 meters/sec
2
. Ignoring air resistance and other drag
forces, what is the maximum height of the ball and when does it hit the
ground?
5. Select the
ZoomStd viewing window,
which automatically graphs the functions.
In the standard viewing window, both the
x and y axes range from L10 to 10.
However, this range is spread over a longer
distance along the x axis than the y axis.
Therefore, the circle appears as an ellipse.
Press „ 6
6. Select
ZoomSqr.
ZoomSqr increases the range along the
x axis so that circles and squares are shown
in correct proportion.
Press „ 5
Steps and keystrokes Display
1. Display the MODE dialog box. For Graph
mode, select PARAMETRIC.
Press 3 B 2 ¸
Steps and keystrokes Display
Notice slight gap
between top and
bottom halves.

 Loading...


