Previews 63
Note: You can also display the graph as an implicit plot by using the
GRAPH FORMATS dialog box (8 Í). If you press: Í to switch between
styles, the implicit plot is not displayed.
Differential Equation Graphing
Graph the solution to the logistic 1st-order differential equation
y' = .001y…(100Ny). Start by drawing only the slope field. Then enter initial
conditions in the Y= Editor and interactively from the Graph screen.
8. Return to the initial orientation.
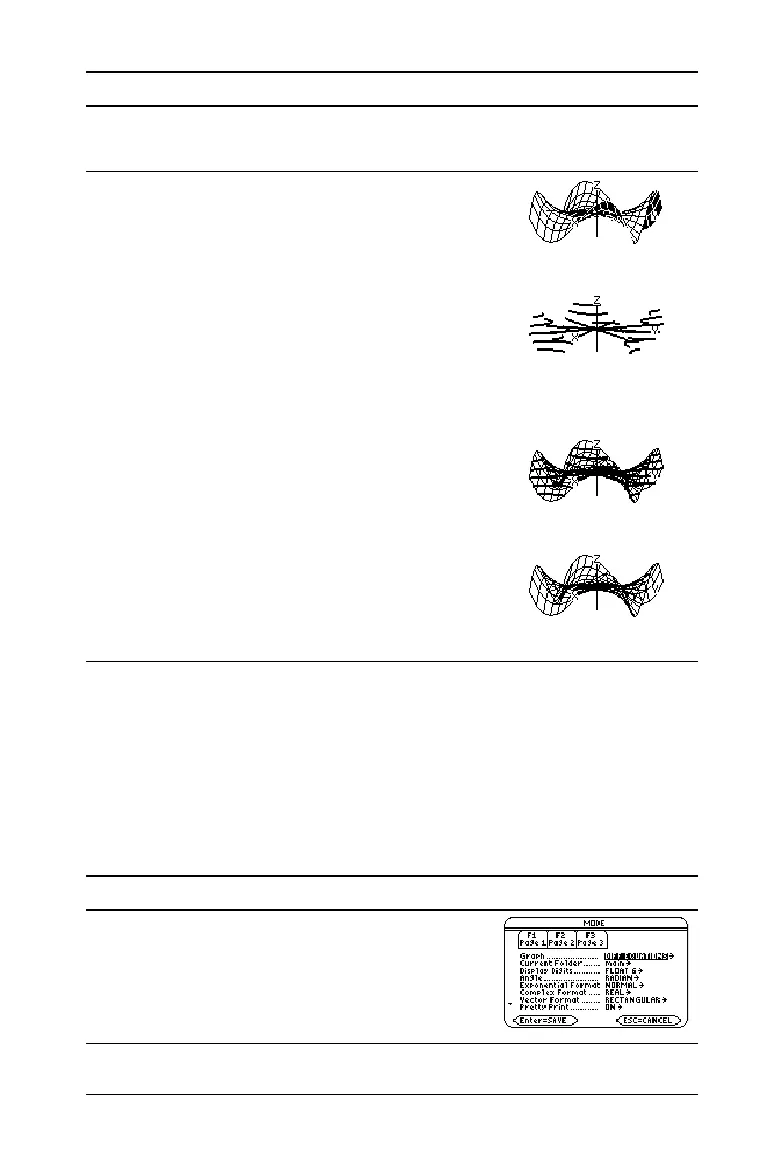
Press 0 (zero)
9. Display the graph in different graph format
styles.
@ Í (press Í to switch from each style
to the next)
HIDDEN SURFACE
CONTOUR LEVELS
(may require extra time to
calculate contours)
WIRE AND CONTOUR
WIRE FRAME
Steps and keystrokes Display
1. Display the
MODE dialog box. For Graph
mode, select DIFF EQUATIONS.
Press 3 B 6 ¸
Steps and keystrokes Display

 Loading...


