Previews 61
3D Graphing
Graph the 3D equation z(x,y) = (x
3
y N y
3
x) / 390. Animate the graph by
using the cursor to interactively change the eye Window variable values
that control your viewing angle. Then view the graph in different graph
format styles.
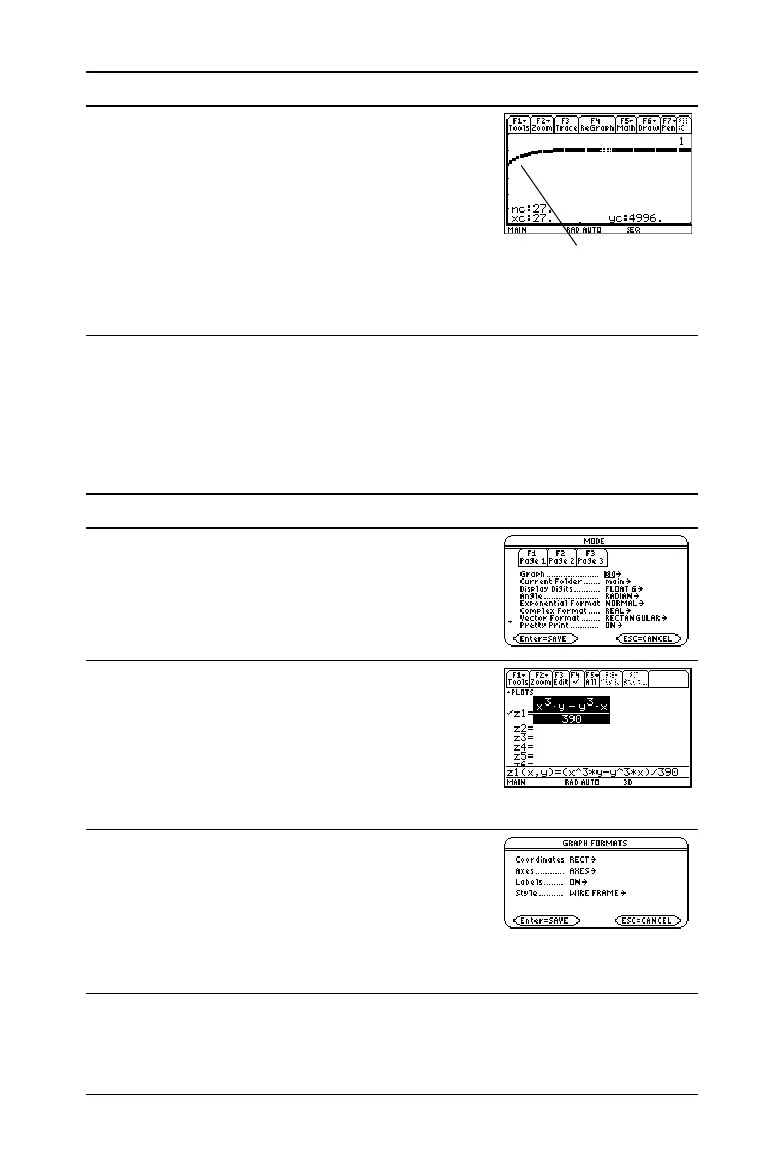
7. Select Trace. Move the cursor to trace year
by year. How many years (nc) does it take
the number of trees (yc) to stabilize?
Trace begins at nc=0.
nc is the number of years.
xc = nc since n is plotted on the x axis.
yc = u1(n), the number of trees at
year n.
Press … B and A as necessary
Steps and keystrokes Display
1. Display the
MODE dialog box. For Graph
mode, select 3D.
Press 3 B 5 ¸
2. Display and clear the Y= Editor. Then define
the 3D equation z1(x,y) = (x
3
y N y
3
x) / 390.
Notice that implied multiplication is used in
the keystrokes.
Press 8 # , 8 ¸ ¸ c X Z 3 Y |
Y Z 3 X d e 390 ¸
3. Change the graph format to display and
label the axes. Also set
Style = WIRE
FRAME
.
You can animate any graph format style,
but WIRE FRAME is fastest.
@8 Í D B 2 D B 2 D B 1 ¸
Steps and keystrokes Display
By default, sequences use
the Square display style.

 Loading...


