68 Previews
Split Screens
Split the screen to show the Y= Editor and the Graph screen. Then
explore the behavior of a polynomial as its coefficients change.
4. Display the Table screen.
Press 8 '
5. Scroll through the table. Notice that y1
changes sign at x = M1, 1, and 2.
To scroll one page at a time, use 2D and
2C.
Press D and C as necessary
6. Zoom in on the sign change between x = L2
and x = L1 by changing the table parameters
to:
tblStart = L2
@tbl = .1
Press „ ? 2 D .1 ¸ ¸
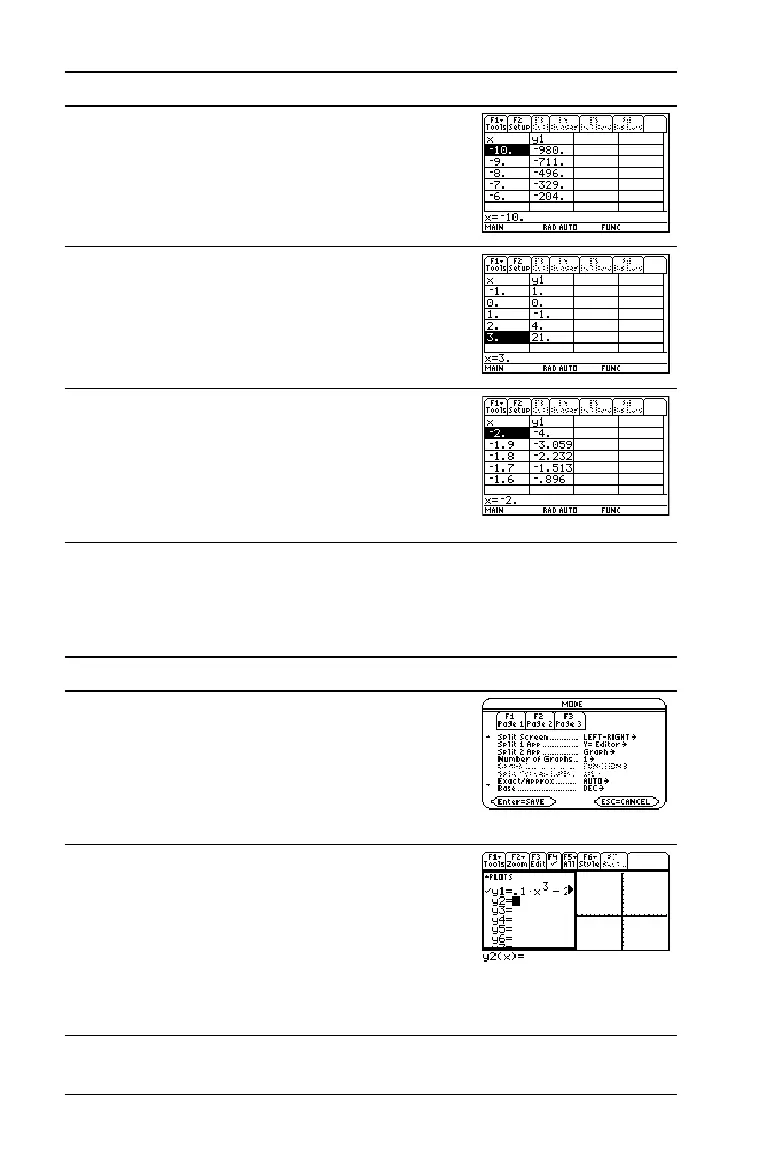
Steps and keystrokes Display
1. Display the
MODE dialog box.
For Graph, select FUNCTION.
For
Split Screen, select LEFT-RIGHT.
For Split 1 App, select Y= Editor.
For Split 2 App, select Graph.
Press 3 B 1 „ B 3 D B 2 D B 4 ¸
2. Clear the
Y= Editor and turn off any stat
data plots. Then define y1(x) = .1x
3
N2x+6.
A thick border around the
Y= Editor
indicates it is active. When active, its entry
line goes all the way across the display.
Press , 8 ¸ ‡ 5 ¸ .1 X Z 3 | 2 X
« 6 ¸
Steps and keystrokes Display
 Loading...


