© 2007-2012 Thorlabs GmbH
48 WFS Series
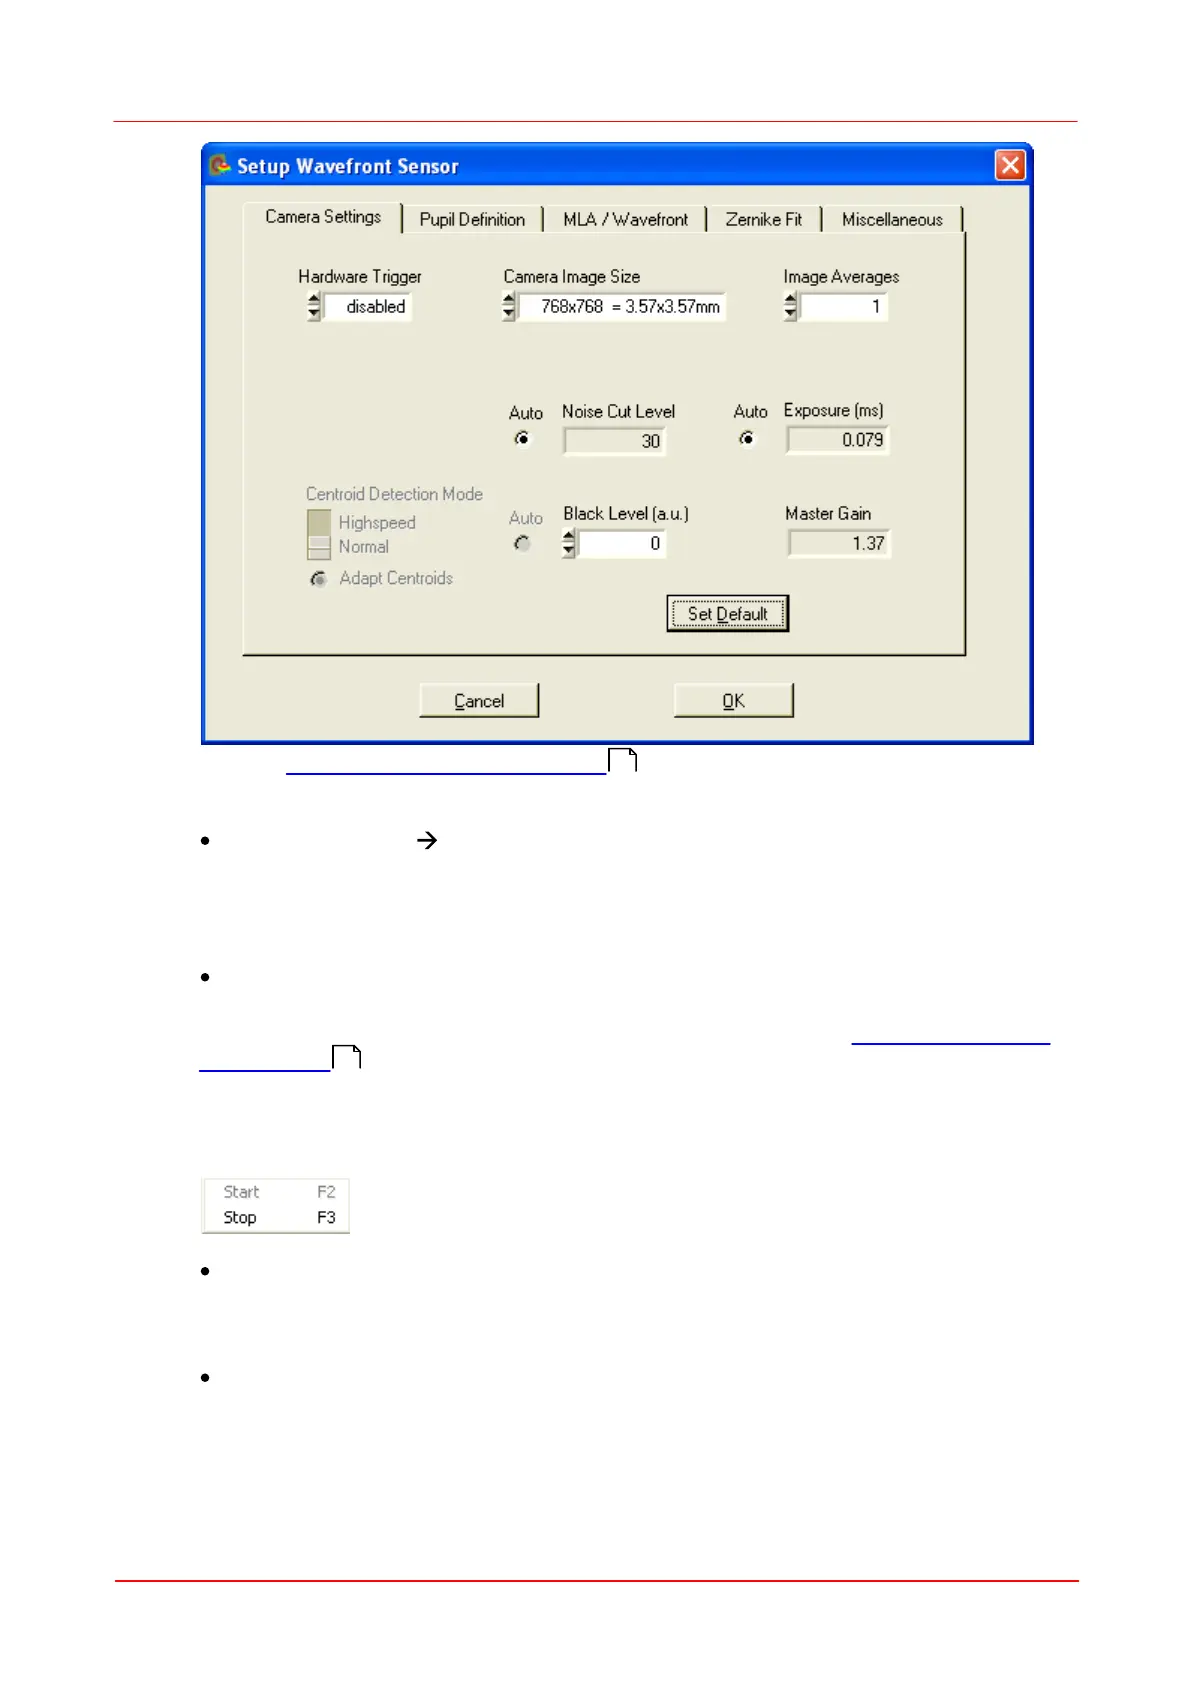
See the Wavefront Sensor Setup Panel chapter for a detailed description of all
setup controls.
Configure Graph Lineview / Spotfield / Beamview / Wavefront / Zernike
Opens a configuration panel to the appropriate graphical display. A more direct way
to open these configuration panels is to double-click onto the graphical panel
you like to configure.
DataSocket
Will display a dialog panel for enabling and configuring the live transfer of
measurement data via DataSocket to another application. See DataSocket for live
data transfer for details.
3. Measurement
The following pull down menu occurs:
Measurement Start
Starts continuous Wavefront Sensor measurements and displays the results on the
screen.
Measurement Stop
Stops the Wavefront Sensor measurement immediately and terminates the screen
updates to keep the actual displayed graphical plots and numerical values to survey
and/or save these data.
6
5
109
 Loading...