© 2007-2012 Thorlabs GmbH
60 WFS Series
Wavefront Select Switch
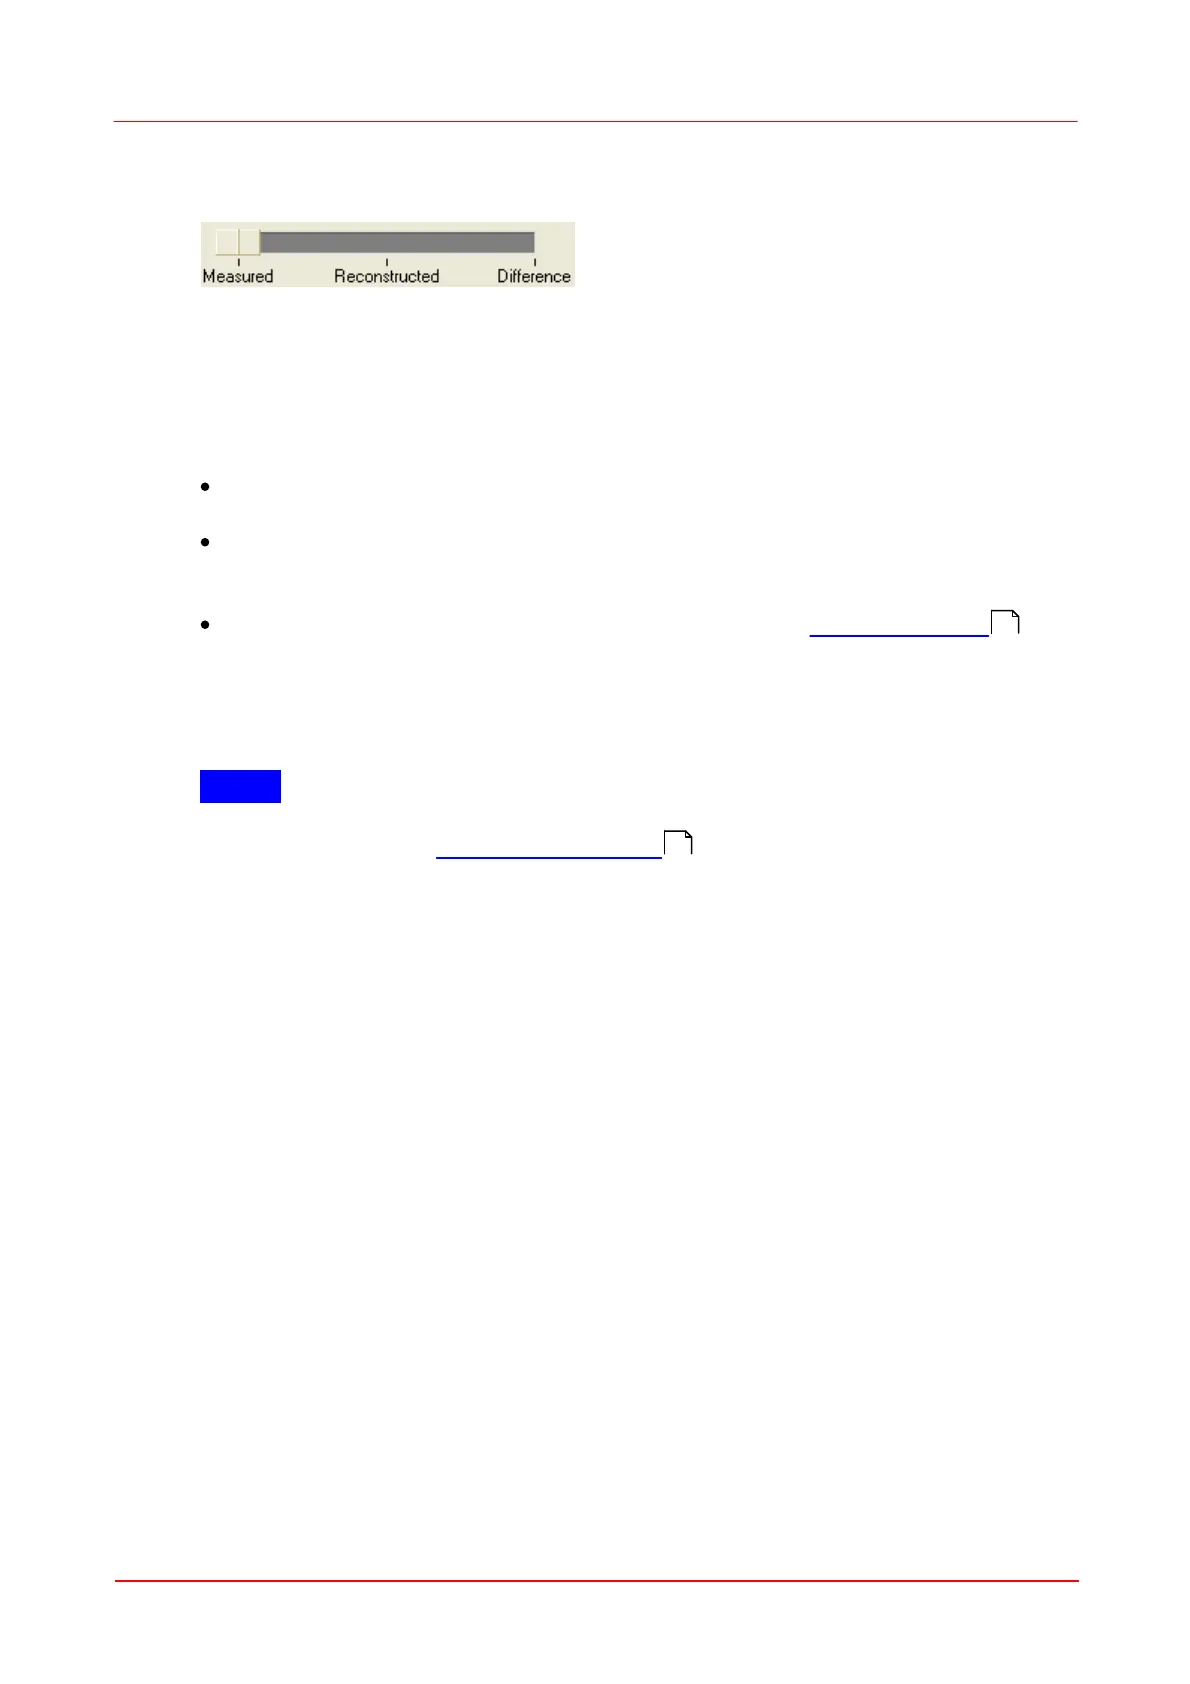
The switch below the graph determines the wavefront type that is displayed.
'Measured' shows the wavefront which is directly calculated from the measured spot
deviations using a 2-dimensional integration.
'Reconstructed' will display a wavefront that is reconstructed using all or only a
selected set of the determined Zernike coefficients. The advantages of this display
is:
The wavefront surface is smoothed because noise is canceled out when only a few
low order Zernike modes are selected for reconstruction.
Lowest order Zernike terms which are always present but are of less interest (for
instance piston, tip, tilt) can be canceled in order to see only the higher order
modes of interest.
Only particular Zernike modes that are enabled within the Zernike Fit Setup
panel can be displayed and analyzed separately.
'Difference' displays the difference between the measured and reconstructed
wavefront and is therefore an indicator of the fit error.
NOTE
The actual switch setting is also important to the calculated wavefront statistics PV,
RMS and wRMS (see Measurement Results ) because the displayed values refer
to the selected wavefront (Measured, Reconstructed or Difference).
Direct rotation, zoom and shifting of the 3D graph
You can zoom and shift the displayed 3D beam profile using the mouse and modifier
key Alt and Shift:
To rotate the graph about both longitude and latitude angles just click and hold the
left mouse button on the graph and drag it.
To zoom press and hold Alt key, then click and hold the left mouse button while
moving the mouse.
Shifting the graph within the drawing area is done with pressing the Shift key and
holding the left mouse button while dragging the mouse.
Double click on the graph to see the 'Wavefront Graph Configuration' panel.
8
3
88
 Loading...