䕔
3-16
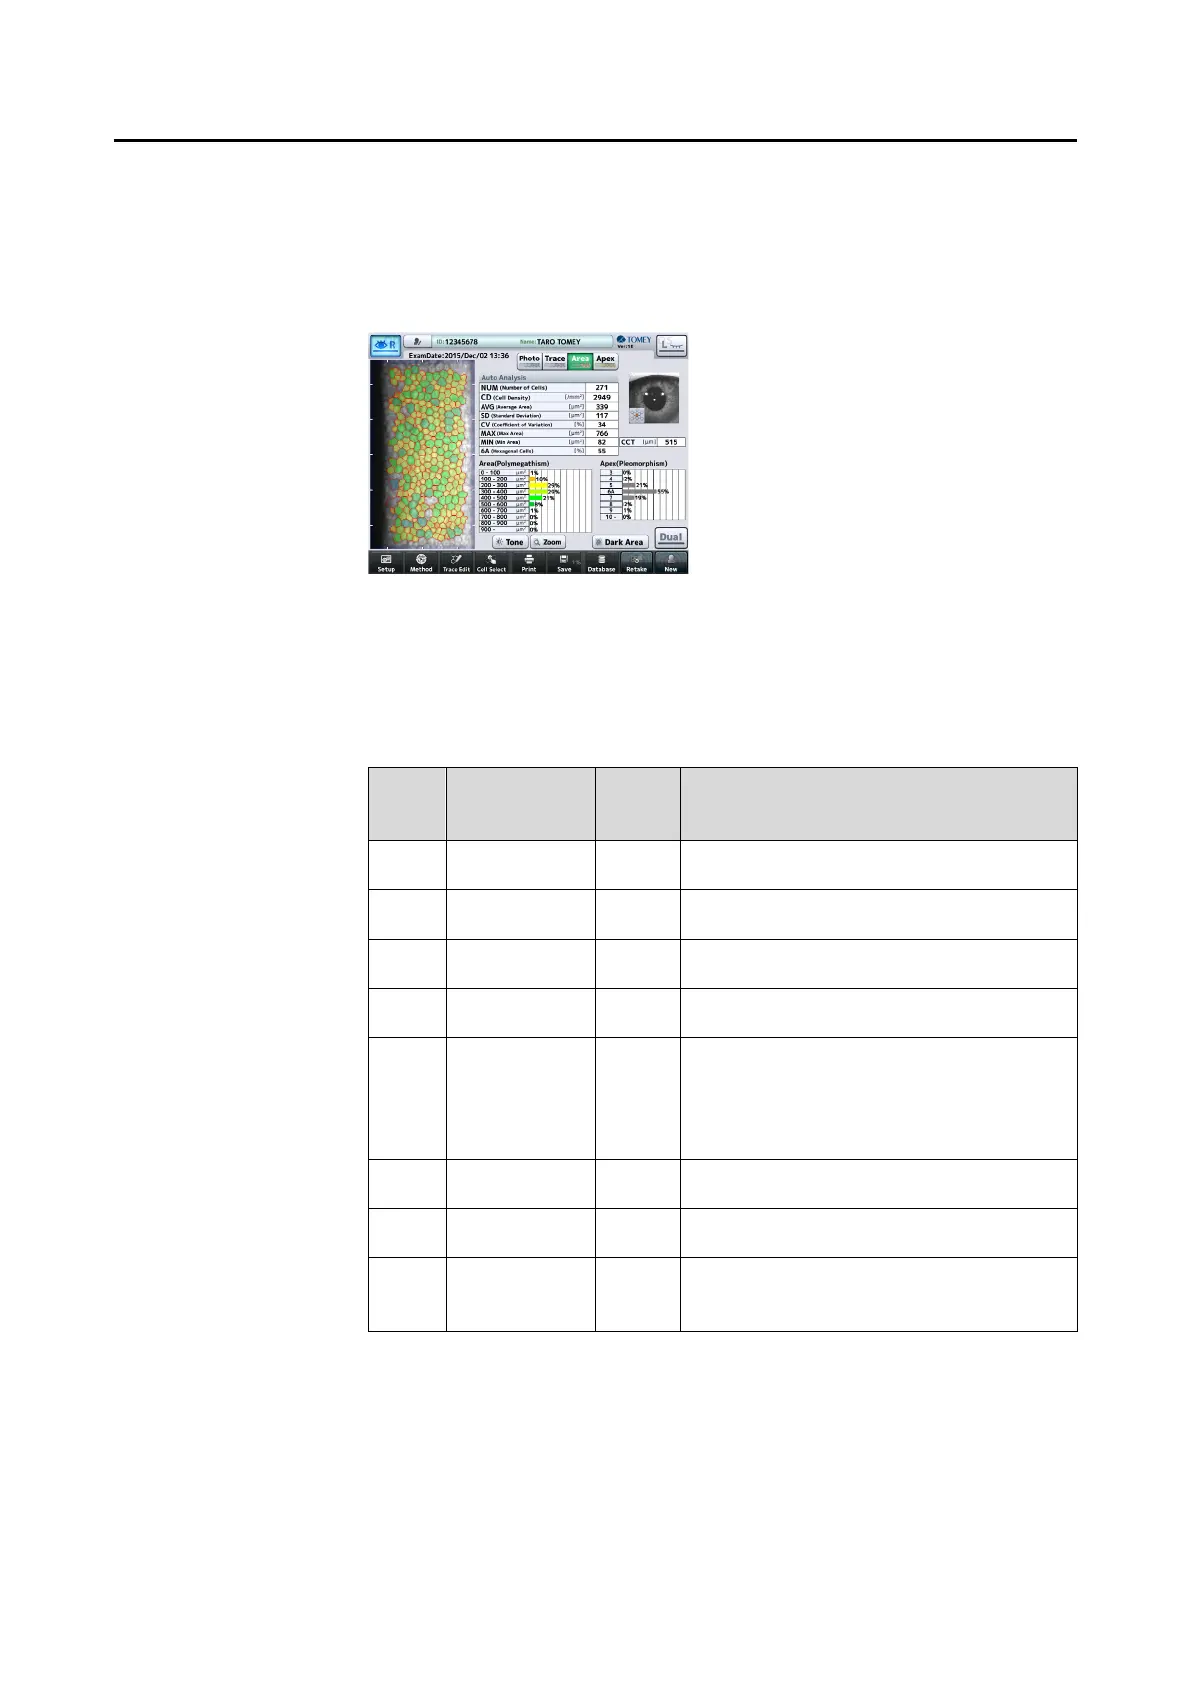
Ɣ Single eye analysis screen
Touch the eye selection button (1) on the R/L eye analysis screen (Fig. 1).
The single eye analysis scren (Fig. 2) appears. Distribution according to cell
sizes and shapes is shown in a histogram on the single eye selection
screen.
(Fig. 2)
Ɣ Checking analysis value
The displayed endothelium image is automatically analyzed and resultant
values are displayed on the R/L eye analysis screen and single eye analysis
screen.
Abbr
eviati
on
Item Unit Details
NUM Number of
cells
Pieces The number of analyzed endothelium
tissues
CD Cell density /mm
2
The number of analyzed endothelium
tissues in 1 mm
2
AVG Average area ȝm
2
The average area of analyzed
endothelium tissues
SD Standard
deviation
ȝm
2
Standard deviation of the area of
analyzed endothelium tissues
CV Fluctuation
coefficient
% Fluctuation coefficient of the area of
analyzed endothelium tissues
Value calculated by dividing the
standard deviation with the average
area.
MAX Maximum
area
ȝm
2
The area of the largest cell in the
analyzed endothelium tissues
MIN Minimum
area
ȝm
2
The area of the smallest cell in the
analyzed endothelium tissues
6A Percentage
of cell
hexagonality.
% Percentage of hexagonal cells in
analyzed endothelium tissues
- A hyphen (-) is displayed for all analysis values if the cell trace line could
not be extracted by automatic analysis.
 Loading...