3-17䢢
䕔
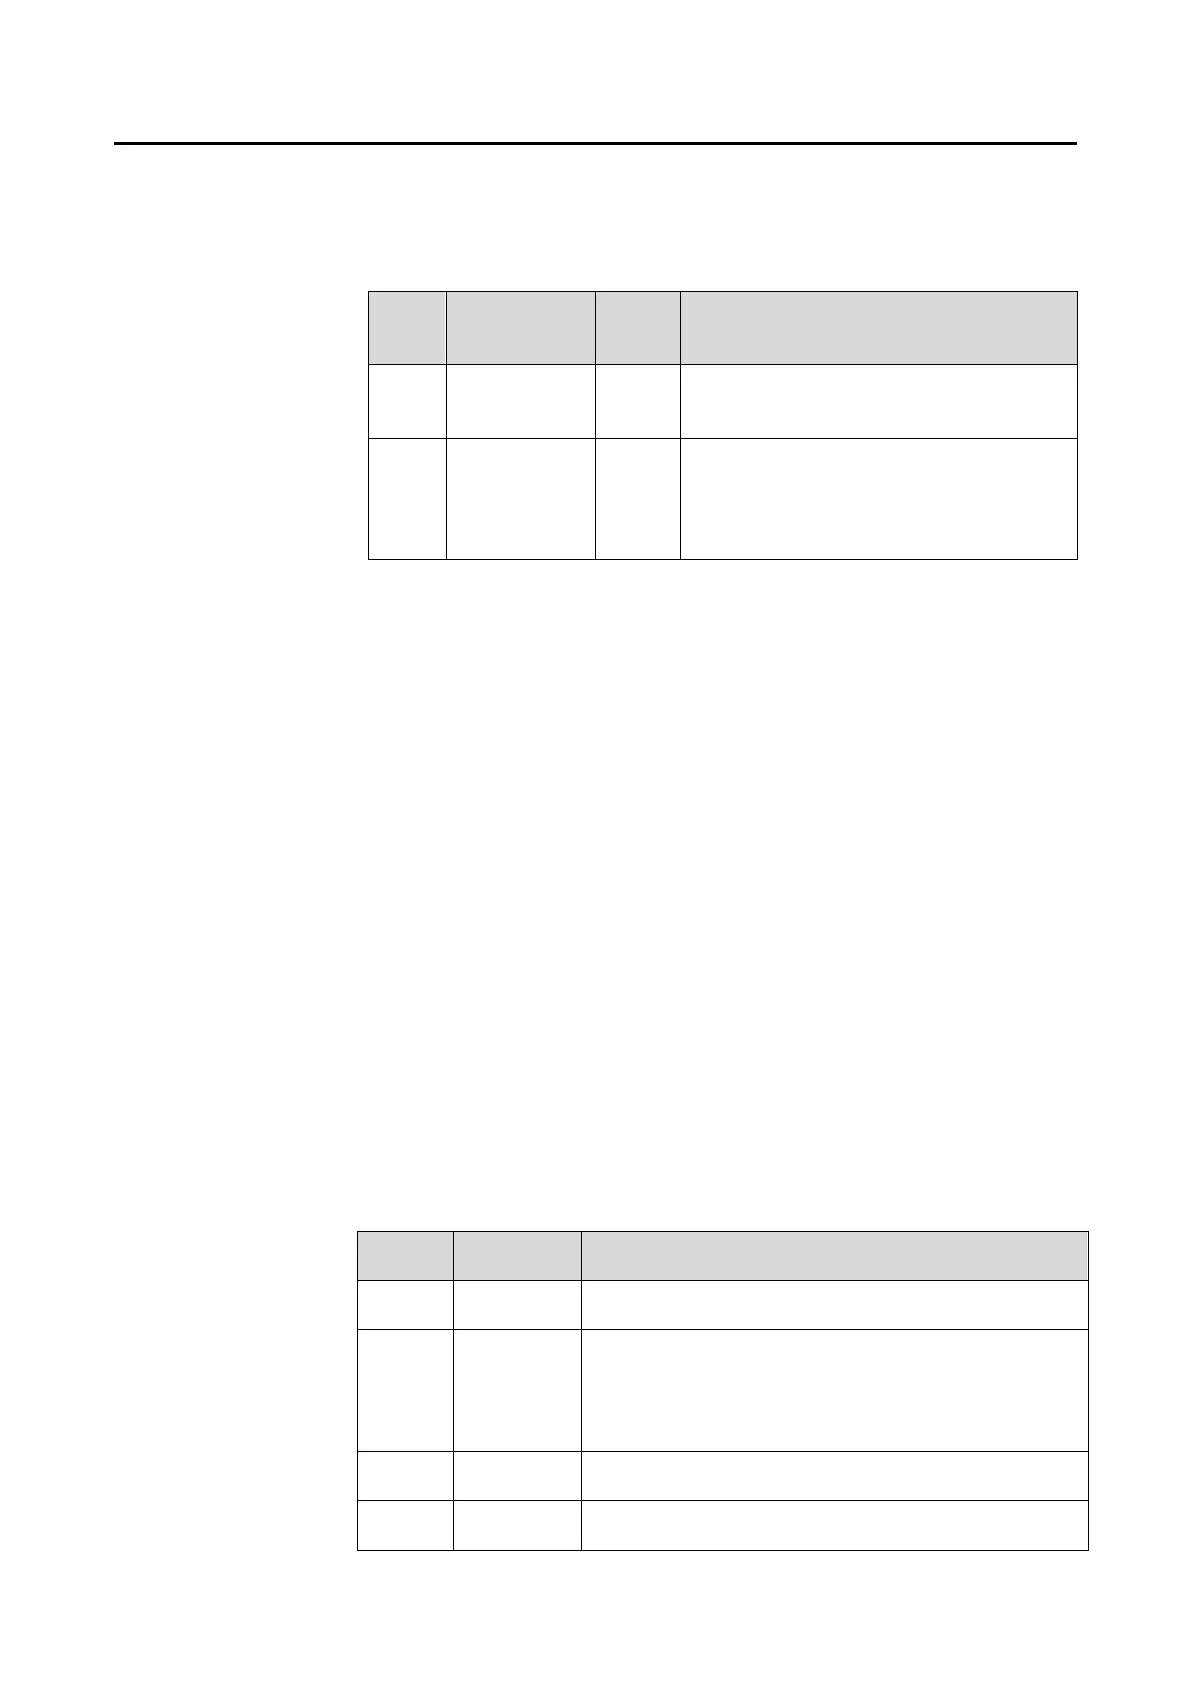
Ɣ Checking central corneal thickness
The measured central corneal thickness is shown on the R/L eye analysis
screen and single eye analysis screen.
Abbr
eviati
on
Analysis item Unit Details
CCT Central
corneal
thickness
ȝm Central corneal thickness
CCT
(US)
Ultrasonic
correction for
central
corneal
thickness
ȝm The reference value expected when
measuring the same corneal thickness
using the ultra-sound corneal thickness
measuring instrument
- A hyphen (-) is shown in CCT and CCT (US) when CCT cannot be
measured.
- It can be set on the System Setup screen whether to show “CCT (US)” or not.
Refer to “3.7.3 Application" for setting method. The initial setting is OFF.
- CCT (US) is calculated by adding a specific thickness (offset value) to
CCT. The offset value can be changed on the System Setup screen.
Refer to “3.7.3 Application" for setting method. The initial setting is
“13ȝm.”
Ɣ Checking distribution according to sizes/shapes
Distribution according to cell sizes and shapes obtained by automatically
analyzing the displayed image of endothelium tissues is displayed using a
histogram on the single eye analysis screen.
- The class width of distribution according to cell sizes can be set on the
System Setup screen. Refer to “3.7.3 Application" for setting method. The
initial setting is “100 ȝm
2
.”
- If the cell trace line cannot be extracted correctly by automatic analysis,
neither a bar nor a number is displayed on the histogram.
Ɣ Changing displayed image
The displayed endothelium image is automatically analyzed and resultant
images are displayed on the R/L eye analysis screen and single eye analysis
screen. Use the following buttons to change the image.
Abbrevi
ation
Item Details
Photo Captured
image
Displays the captured image.
Trace Cell trace
line
Displays trace lines of extracted endothelium tissue
in red.
The trace line of the dark area is shown in blue when
the dark area is extracted. Refer to “1.3 Glossary”
for dark area.
Area Area-speci
fic
Displays an endothelium image color-coded
according to cell area.
Apex Shape
specific
Displays an endothelium image color-coded
according to cell shapes.
 Loading...