䕔
3-44
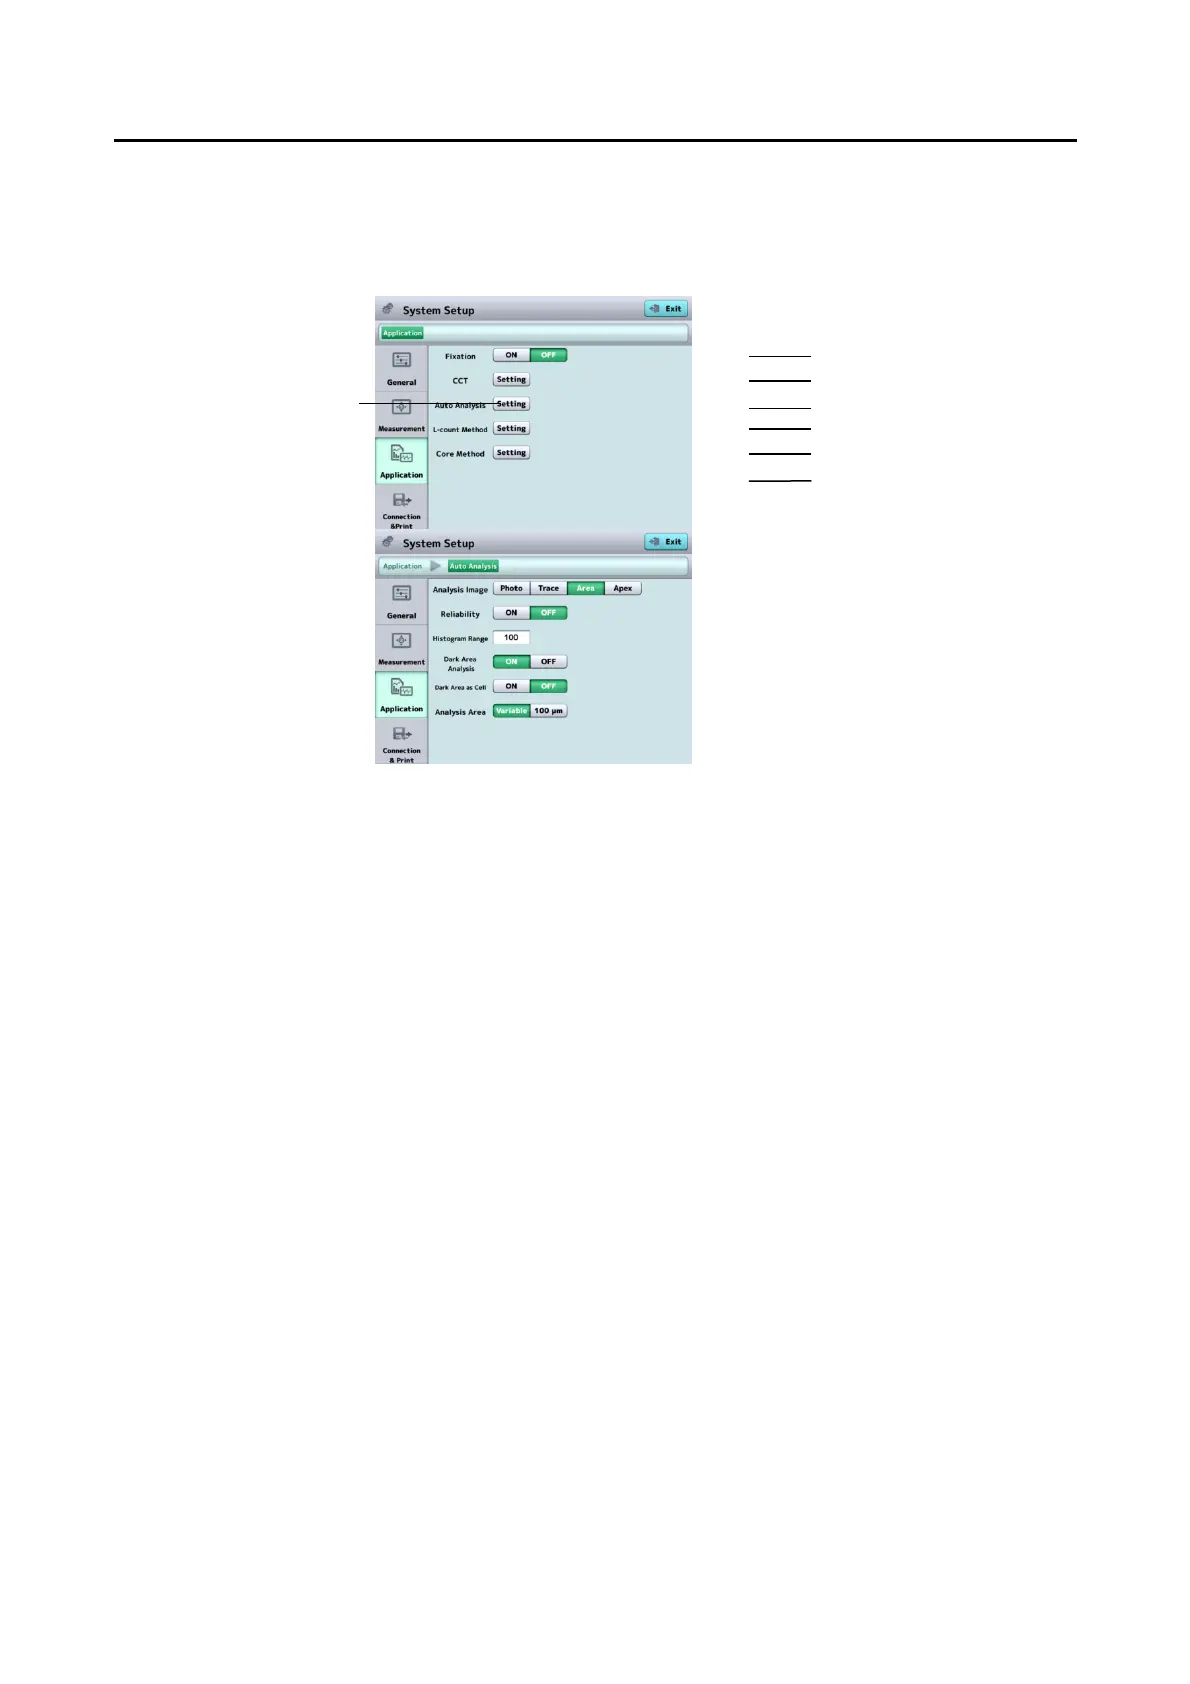
b) Auto Analysis
Touch the “Setting” button (1) of “Auto Analysis” to open the System Setup
screen (Fig. 2).
(Fig. 1) (Fig. 2)
(2) Analysis result
Sets images (Photo, Trace, Area, or Apex) to be shown immediately
after analysis is completed.
(3) Reliability
Set whether to display the reliability mark on the screen.
(4) Histogram Range
Set the range displayed by a histogram of area-specific distribution.
Initial setting
䠖
100 ȝm
2
Setting range
䠖
1 - 999 ȝm
2
(in increments of 1 ȝm
2
)
(5) Dark Area Analysis
Turns the dark area detection function on and off.
Dark areas are not detected when set to OFF.
(6) Dark Area as Cell
Sets whether to regard detected dark areas as endothelium tissues and
include them in analysis of endothelium tissues. This item is not
displayed when “(5) Dark Area Analysis” is set to OFF.
(7) Analysis Area
Sets how to specify the range using the analysis range selection button
of the auto analysis/edit trace line function.
Variable
䠖
Set the analysis range by specifying two opposing
points.
100 ȝm
䠖
Set the analysis range to 100 ȝm2 regarding a point
specified on the image of endothelium tissues as the
center.
(1)
(2)
(3)
(4)
(5)
(6)
(7)
 Loading...