30 PT-55 User’s Guide
Main Screen Details D291308.7M.fm
Click the Supervisor button to open the Supervisor Settings screen.
Details on the Settings fields can be found in the Supervisor Settings
Screen Details section which follows.
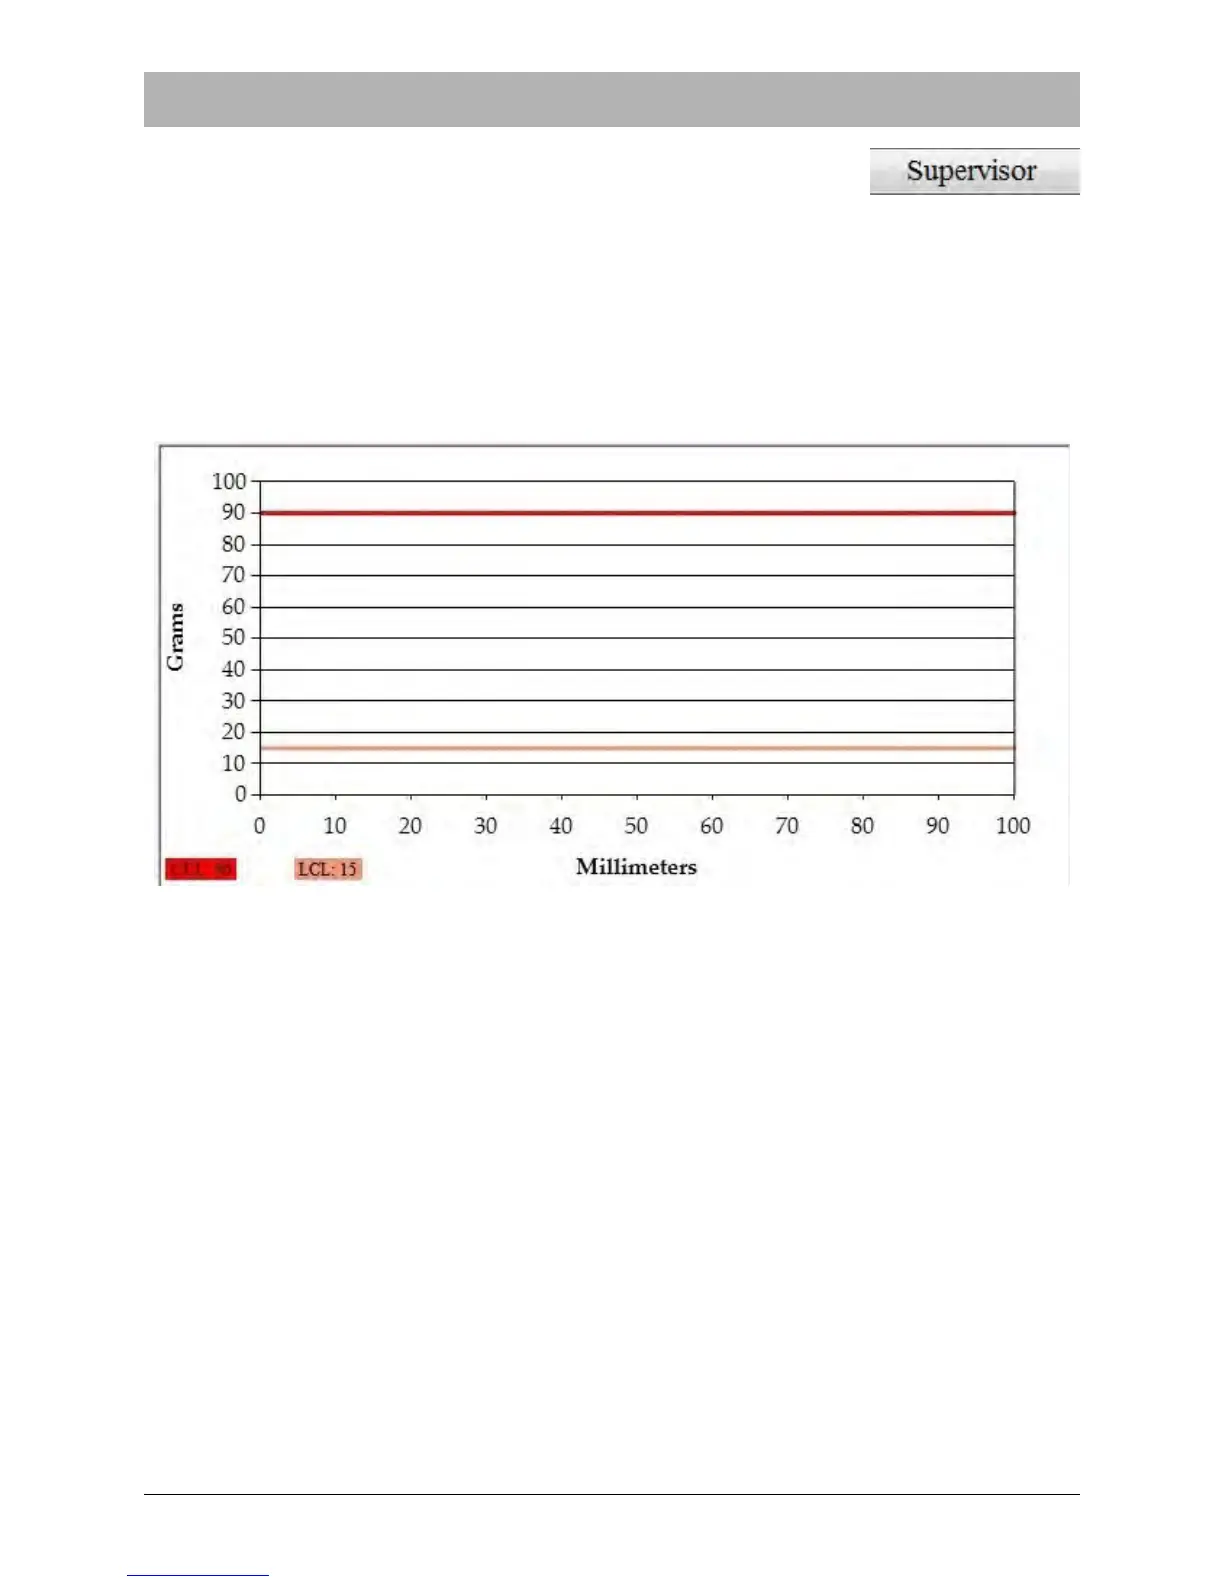
Peel Test Graph
The Peel Test Graph displays the test parameters that were configured in the Settings section.
The example below shows a Peel Test Graph after settings have been configured and before the
test has been run.
The Upper Limit value of 90 is represented by a red line while the Lower Limit value of 15 is rep-
resented by a pink line. The graph’s x axis is 100 mm long which corresponds to the X Axis Max-
imum value which was set in the Settings section.
Note: The PT-55 will read a Pull Length value of 0 as no pull length limit. In this case, the pull
length will be the maximum distance of 100mm.