2.22 Programmable stages (99)
VAMP 24h support phone +358 (0)20 753 3264
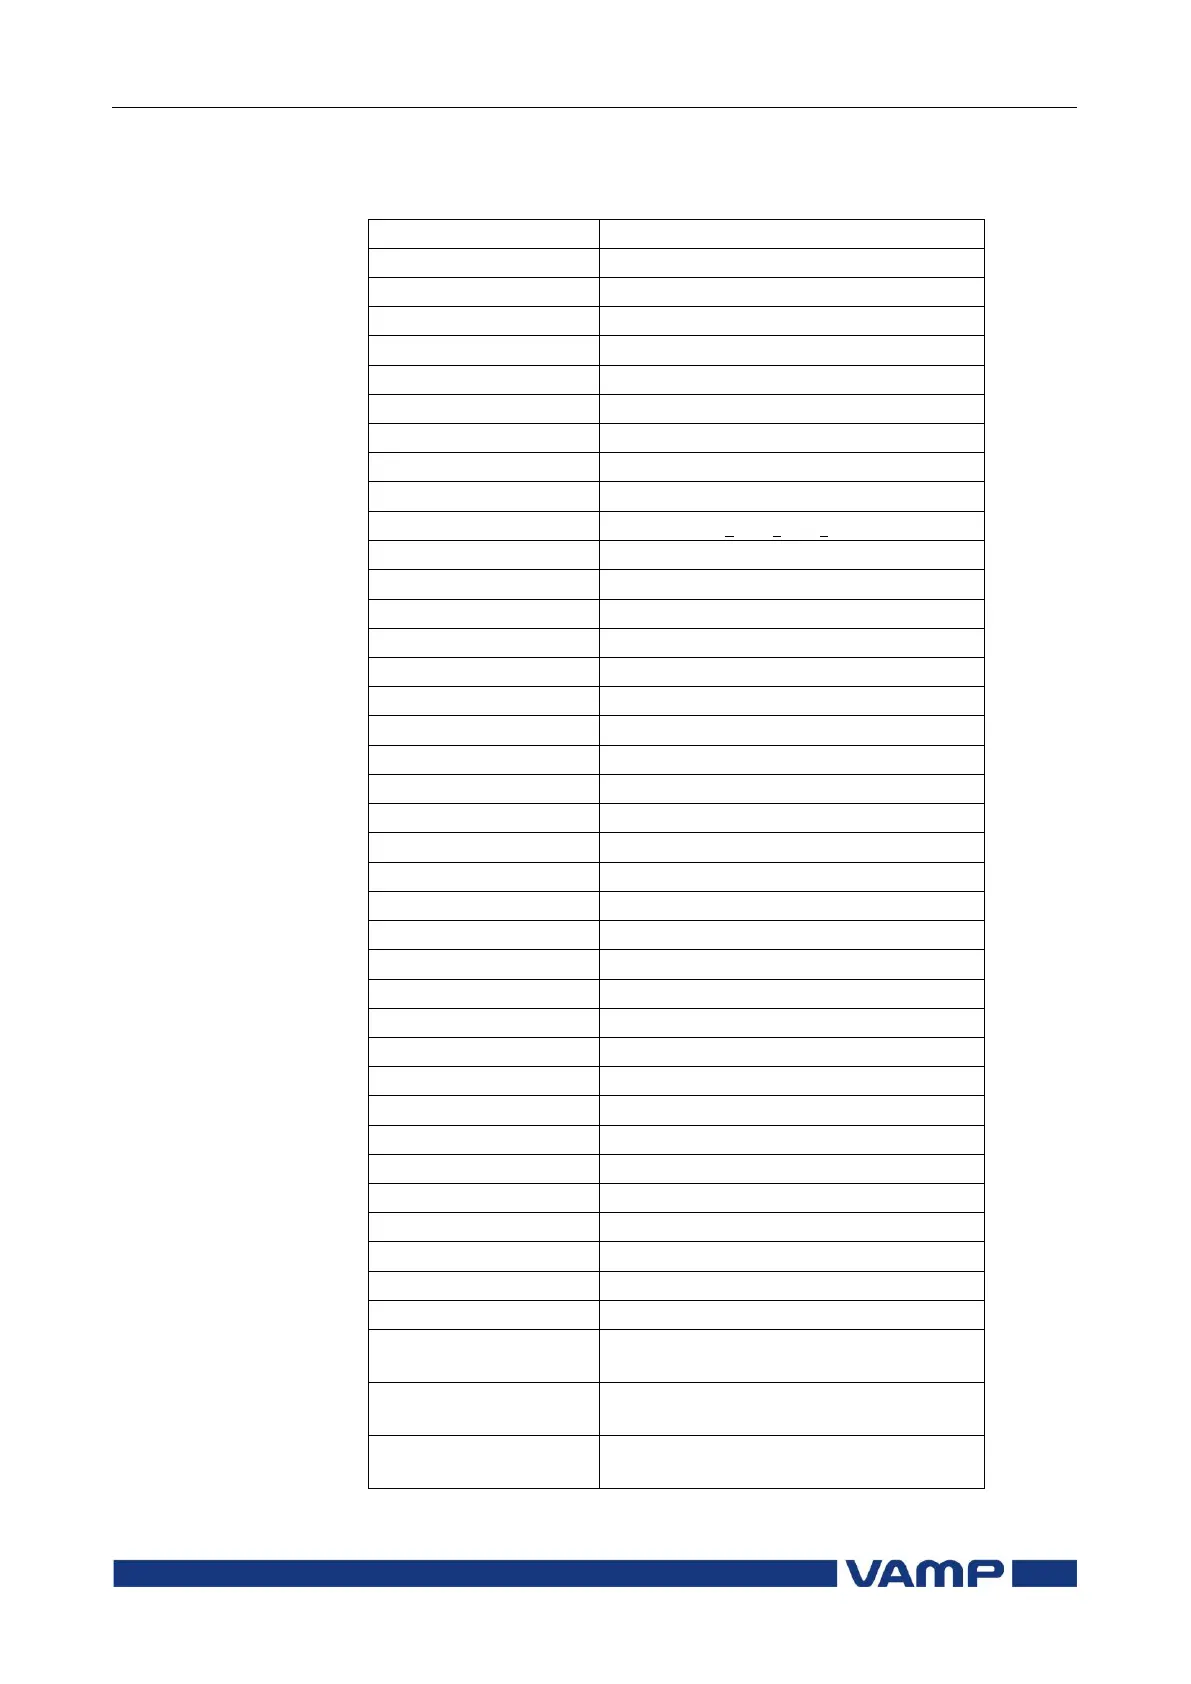
Table 2.22-1 Available signals to be supervised by the
programmable stages
Residual current input I
0
Phasor sum I
L1
+ I
L2
+ I
L3
Positive sequence current
Negative sequence current
Relative negative sequence current
Negative sequence current in pu
Positive sequence voltage
Negative sequence voltage
Relative negative sequence voltage
Average (I
L1
+ I
L2
+ I
L3)
/3
Average (U
L1
+ U
L2
+ U
L3)
/3
Average (U
L12
+ U
L23
+ U
L31)
/3
Tangent [=tan(arccos)]
Total harmonic distortion of I
L1
Total harmonic distortion of I
L2
Total harmonic distortion of I
L3
Total harmonic distortion of input U
L1
Total harmonic distortion of input U
L2
Total harmonic distortion of input U
L3
Frequency behind circuit breaker
Frequency behind 2
nd
circuit breaker
I
L1
RMS for average sampling
I
L2
RMS for average sampling
I
L3
RMS for average sampling
Voltage behind circuit breaker
Voltage behind 2
nd
circuit breaker
Minimum and maximum of phase
currents
Minimum and maximum of line
voltages
Minimum and maximum of phase
voltages