2 Local panel user interface
Operation and configuration
VAMP 24h support phone +358 (0)20 753 3264
2.3.2. Measured data
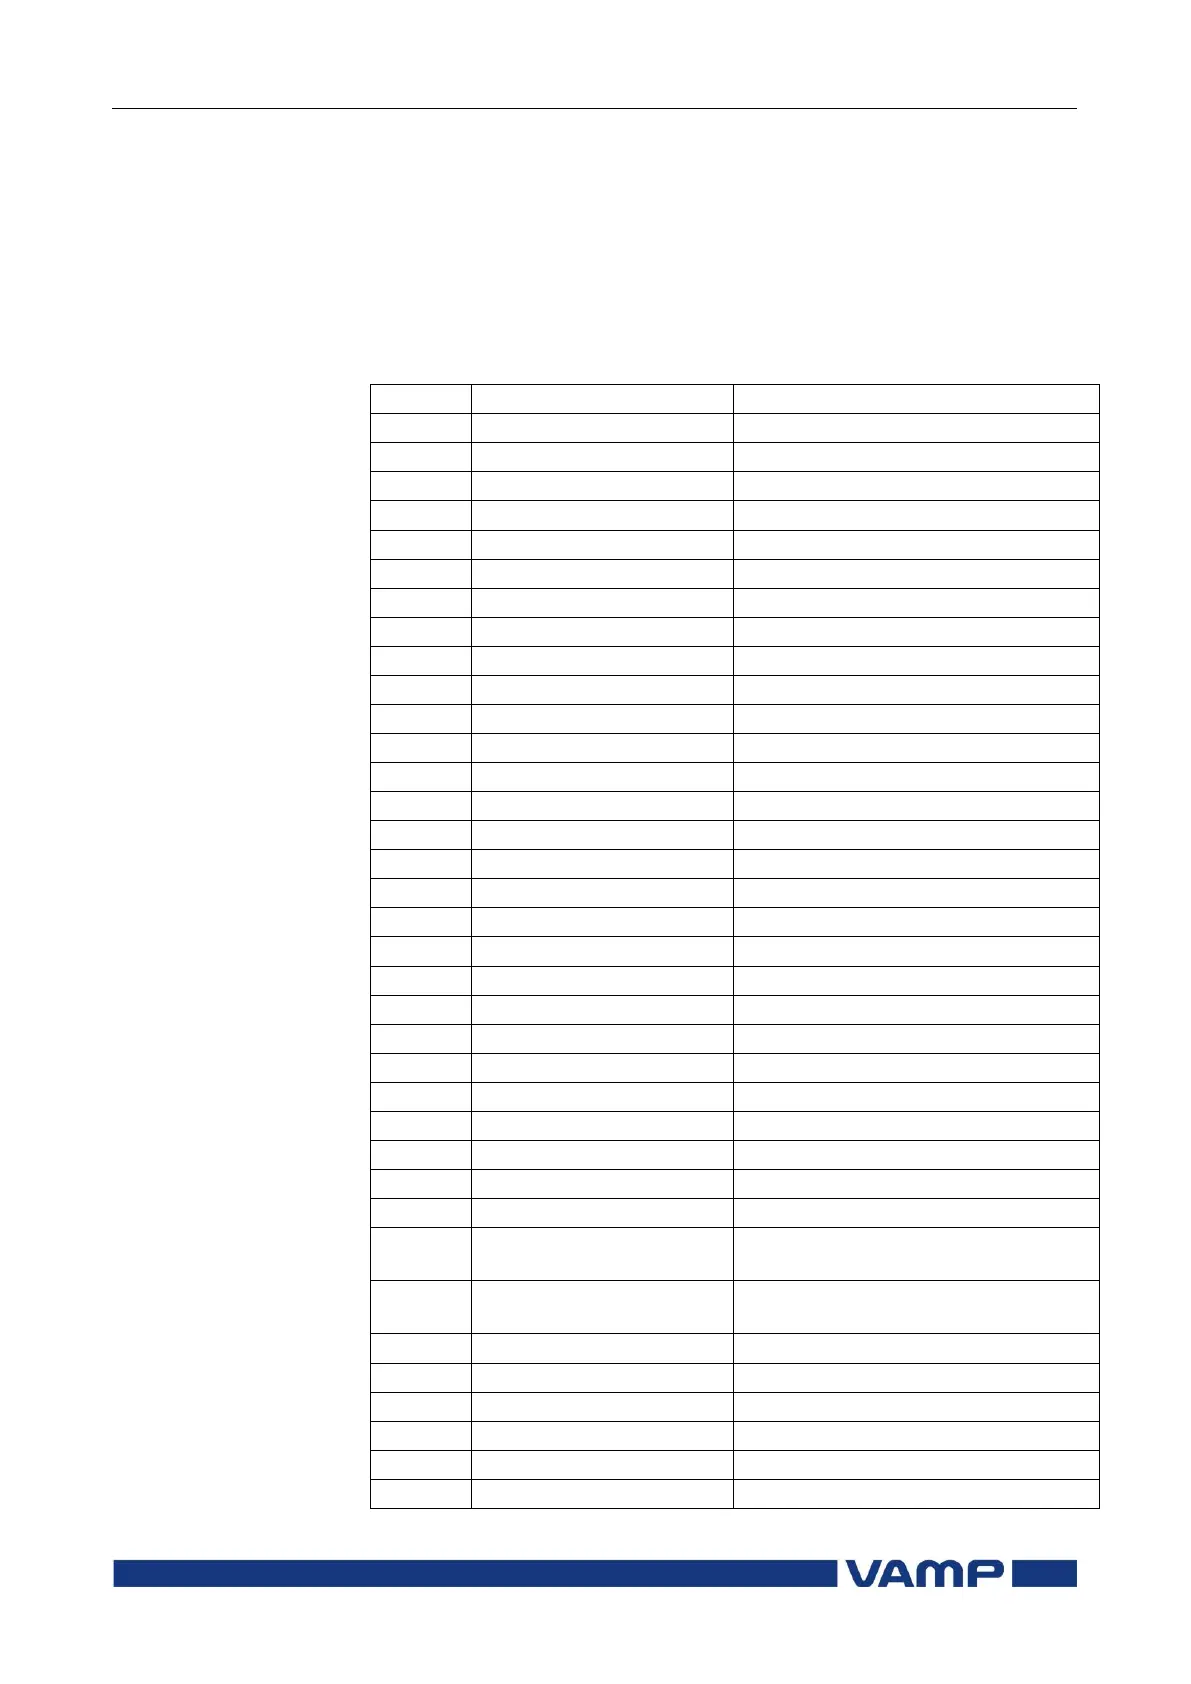
The measured values can be read from the P, E, I and U menus
and their submenus. Furthermore, any measurement value in
the following table can be displayed on the main view next to
the single line diagram. Up to six measurements can be shown.
Impedance measurements (Z12, Z23, Z31) are located in
distance stage displays.
Active power of phase 1 [kW]
Active power of phase 2 [kW]
Active power of phase 3 [kW]
Reactive power of phase 1 [kvar]
Reactive power of phase 2 [kvar]
Reactive power of phase 3 [kvar]
Apparent power of phase 1 [kVA]
Apparent power of phase 2 [kVA]
Apparent power of phase 3 [kVA]
Power factor of phase 1 [ ]
Power factor of phase 2 [ ]
Power factor of phase 3 [ ]
Cosine phi of phase L1 [ ]
Cosine phi of phase L2 [ ]
Cosine phi of phase L3 [ ]
Actual current phase sequency [OK;
Reverse; ??]
Actual voltage phase sequency [OK;
Reverse; ??]
Exported reactive energy [Mvar]
Imported reactive energy [Mvar]