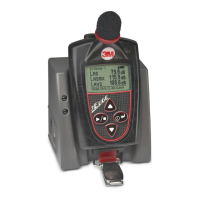
Understanding what data is stored
When you are running noise dosimetry studies, there are two types of data stored on the dosimeter which
include the summary data and time history (or Logged) data.
Summary data
Summary data represents values that occurred over the entire run of the study. For an average value, such
as Lavg, it represents the average decibel value over the entire run time. Peak and Max values are the
highest measurements that occurred throughout the run time.
NOTE: To view C-A measurement results, this is a selectable parameter from the edit panel icon.
Please see Setting up and Viewing C-A measurements.
Figure 3-2: Sample summary data from DMS reporting
Time history
Time history data is also referred as “logged data” which plots measurement values in minute by minute
intervals.
Time History data represents values that occurred over the most recent time period, which is the logging
interval. For example, if the log interval is 1 minute, then the Peak value is the highest Peak value for that 1
minute, and the Lavg value is the average dB value for that 1 minute.
Figure 3-3: Sample time history data (or logged data) chart