40
RTCA SP Instrument Operator’s Manual
C
C
Step 3 typically comes after an action (for example, compound addition) on the
cells.
Depending on the specifi c experiment, appropriate sweep numbers and time intervals
can be set as described for Step 2. For example, to measure rapid kinetics of cell
responses to compound addition, a time interval of one minute can be set. Within
a step, substeps with different time intervals can be used. For example, step three
can consist of 200 sweeps having one minute time intervals and another 200 sweeps
having 15 minute time intervals.
To remove a step, highlight the step and click the Delete a Step icon , or go to
the Steps menu and select Delete a Step.
Please refer to the RTCA Software Manual for more information regarding the
Schedule page and generation of substeps.
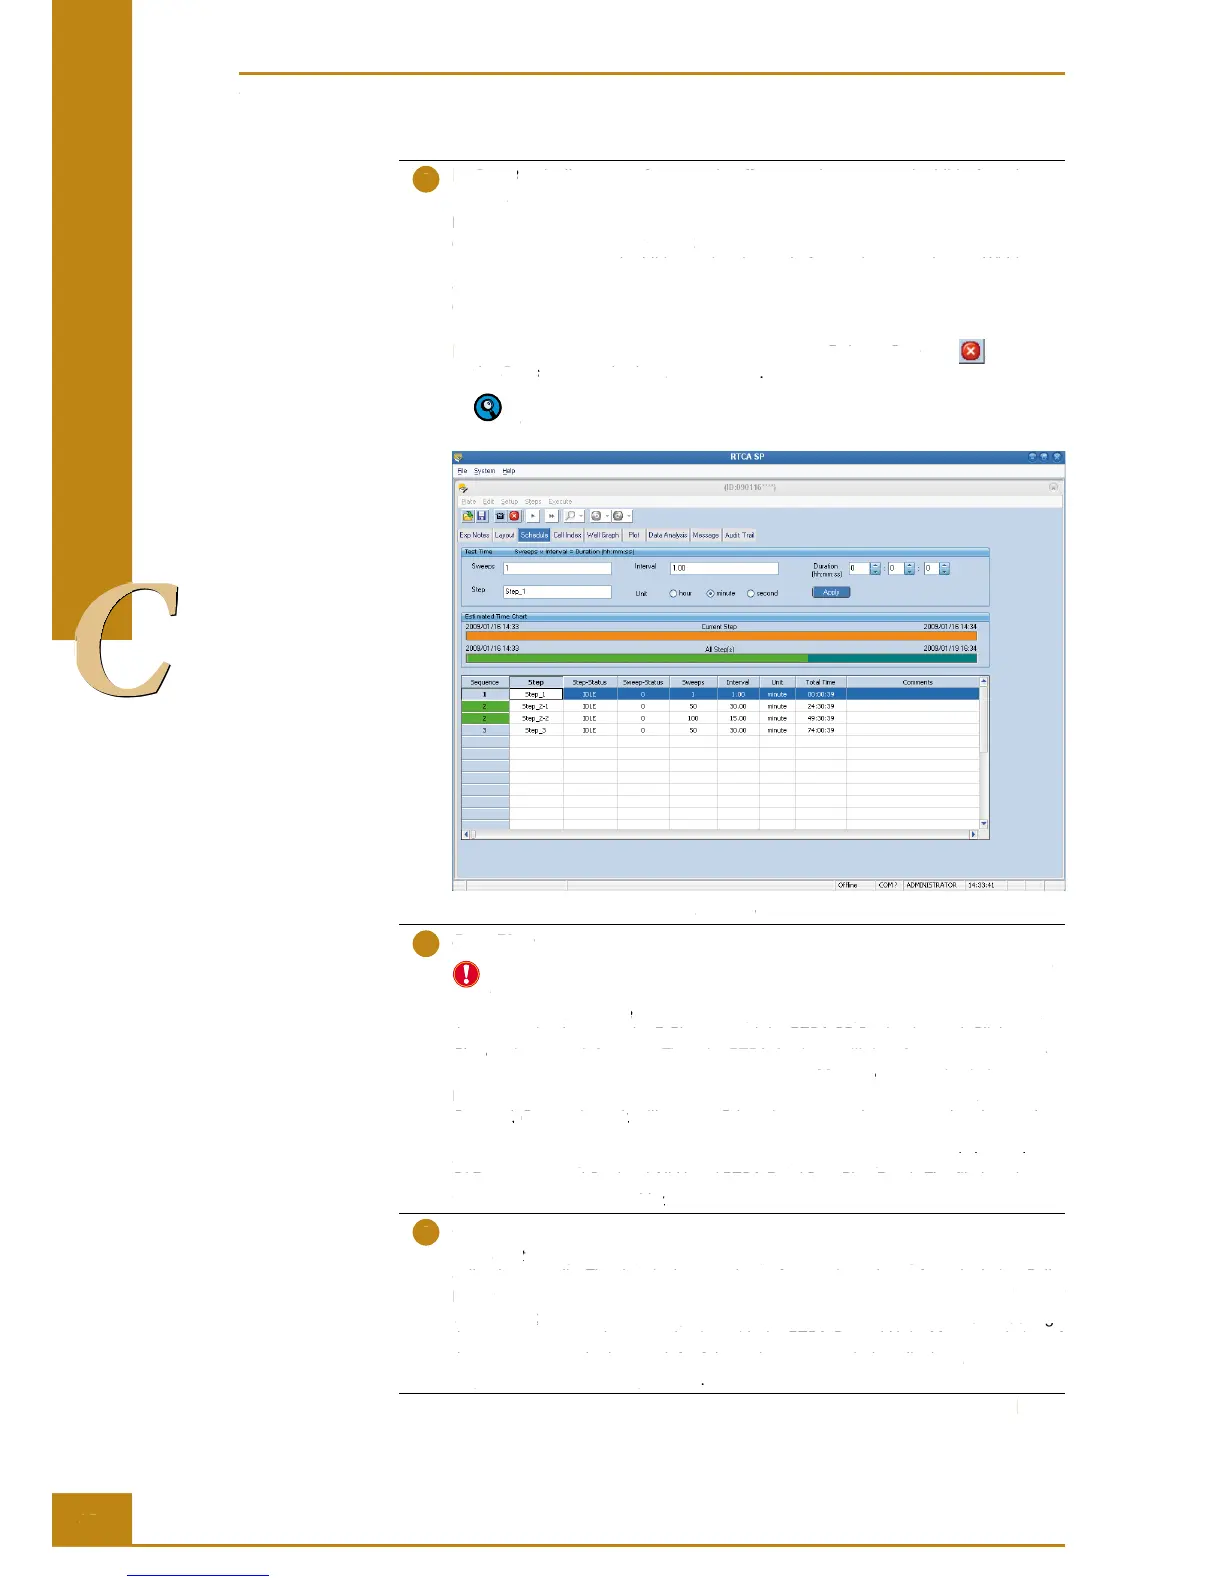
Figure 25: Example of a programmed Schedule page that allocates the Test Time.
Scan Plate function
Scan Plate is automatically performed each time an E-Plate 96 is inserted into the
RTCA SP Station. In addition, Scan Plate can be performed manually.
Always use the Scan Plate function before you start the experiment to make sure that
the connection between the E-Plate 96 and the RTCA SP Station is good. Click Scan
Plate at the upper left corner. Then the RTCA Analyzer will do a frequency scan over
the E-Plate 96 for the selected wells. Next, go to the Message page to check the status.
If the measured resistance value is within the expected range, a message Plate
Scanned. Connections ok. will appear. Otherwise, you need to remove the plate and
re-insert the plate into the RTCA SP Station or do some cleaning. In the meantime,
a data fi le is also generated to record the scan plate data. By default, it is located at
C:\Documents and Settings\All Users\RTCA Data\ScanPlateData\. The fi le has the
format PlateScanningmmddyy.txt.
Start the experiment
Click Start to begin the experiment. This step measures the background impedance of
cell culture media. The data is then used as reference impedance for calculating Cell
Index
values. During the experiment, the bottom of the program window displays Test Col
1, 2, 3 … 12, and the RTCA Analyzer communication and status LED will blink during
the measurement and communication with the RTCA Control Unit. After completion of
the measurement the bottom-left of the main program window displays Ready for Next
Step. Please Click Next Step to start.
Preparing and Starting a Run on the RTCA SP Instrument
Running a Quick Experiment
RTCA SP Instrument Operator’s Manual
typically comes after an action (for example, compound addition) on the
Step 3 typically comes after an action (for example, compound addition) on the Step 3
Depending on the specifi c experiment, appropriate sweep numbers and time intervals
can be set as described for
. For example, to measure rapid kinetics of cell
responses to compound addition, a time interval of one minute can be set. Within
a step, substeps with different time intervals can be used. For example, step three
can consist of 200 sweeps having one minute time intervals and another 200 sweeps
having 15 minute time intervals.
To remove a step, highlight the step and click the
Delete a Step icon Delete a Step
Steps menu and select Steps
Please refer to the RTCA Software Manual for more information regarding the
Schedule page and generation of substeps.
Figure 25: Example of a programmed
page that allocates the Test Time.
Schedule page that allocates the Test Time.Schedule
Scan Plate functionScan Plate
Scan Plate is automatically performed each time an E-Plate 96 is inserted into the
RTCA SP Station. In addition, Scan Plate can be performed manually.
function before you start the experiment to make sure that
Scan Plate function before you start the experiment to make sure that Scan Plate
the connection between the E-Plate 96 and the RTCA SP Station is good. Click
at the upper left corner. Then the RTCA Analyzer will do a frequency scan over
Plate at the upper left corner. Then the RTCA Analyzer will do a frequency scan over Plate
the E-Plate 96 for the selected wells. Next, go to the
page to check the status.
Message page to check the status. Message
If the measured resistance value is within the expected range, a message
. will appear. Otherwise, you need to remove the plate and
Connections ok. will appear. Otherwise, you need to remove the plate and Connections ok
re-insert the plate into the RTCA SP Station or do some cleaning. In the meantime,
a data fi le is also generated to record the scan plate data. By default, it is located at
a data fi le is also generated to record the scan plate data. By default, it is located at
C:\Documents and Settings\All Users\RTCA Data\ScanPlateData\. The fi le has the
C:\Documents and Settings\All Users\RTCA Data\ScanPlateData\. The fi le has the
to begin the experiment. This step measures the background impedance of
to begin the experiment. This step measures the background impedance of
Start to begin the experiment. This step measures the background impedance of Start
cell culture media. The data is then used as reference impedance for calculating Cell
cell culture media. The data is then used as reference impedance for calculating Cell
values. During the experiment, the bottom of the program window displays
values. During the experiment, the bottom of the program window displays
, and the RTCA Analyzer communication and status LED will blink during
, and the RTCA Analyzer communication and status LED will blink during
1, 2, 3 … 12, and the RTCA Analyzer communication and status LED will blink during 1, 2, 3 … 12
the measurement and communication with the RTCA Control Unit. After completion of
the measurement the bottom-left of the main program window displays
Step. Please Click Next Step to start
Step. Please Click Next Step to start.Step. Please Click Next Step to start
Preparing and Starting a Run on the RTCA SP Instrument
Running a Quick Experiment