41
Operation
C
C
Remove the E-Plate 96 and add cells to the E-Plate 96 wells
Remove the E-Plate 96 from the RTCA SP Station by gently releasing the lock handle
upward. The green light turns off.
Add 100 µl of cell suspension to each well. The cell suspension should have been
properly prepared for the desired cell concentrations for the cell titration experiment.
Keep shaking for evenly distributed cell suspension so that each well has proper
cell numbers.
Leave the E-Plate 96 in the tissue culture hood for 30 minutes at room
temperature, so that the cells settle at the bottom of the well.
Reinsert the E-Plate 96 and start step 2
Insert the E-Plate 96 as described above. Lock the E-Plate 96 to the cradle pocket by
turning the lock handle to the horizontal position. The green light turns on when it is
connected properly. Close the incubator door.
A Scan Plate is automatically performed. Go to the Message page to check the
status.
Start step 2 by clicking the Start Step button. During the experiment, note that the bottom
of the program window states Test Col 1, 2,..., 12. The bottom-left of the program
window displays a countdown to the next sweep start time (for example, “0:10:30 left
for 3/100[2]”).
Check and plot the Cell Index data
During the experiment and between sweeps, check the Cell Index or Plot page. In the
Cell Index page, move to different test time points (the time is the time since the start
of the experiment). Cell index values at the time point are shown in boxes. In the Plot
page, plot the cell index for a well as a function of time, by highlighting the well, and
clicking Add. To add another well, repeat the process. By clicking Add All, data for
every well included in the experiment is shown.
For detailed information on how to plot and analyze experimental data please refer
to the RTCA Software Manual.
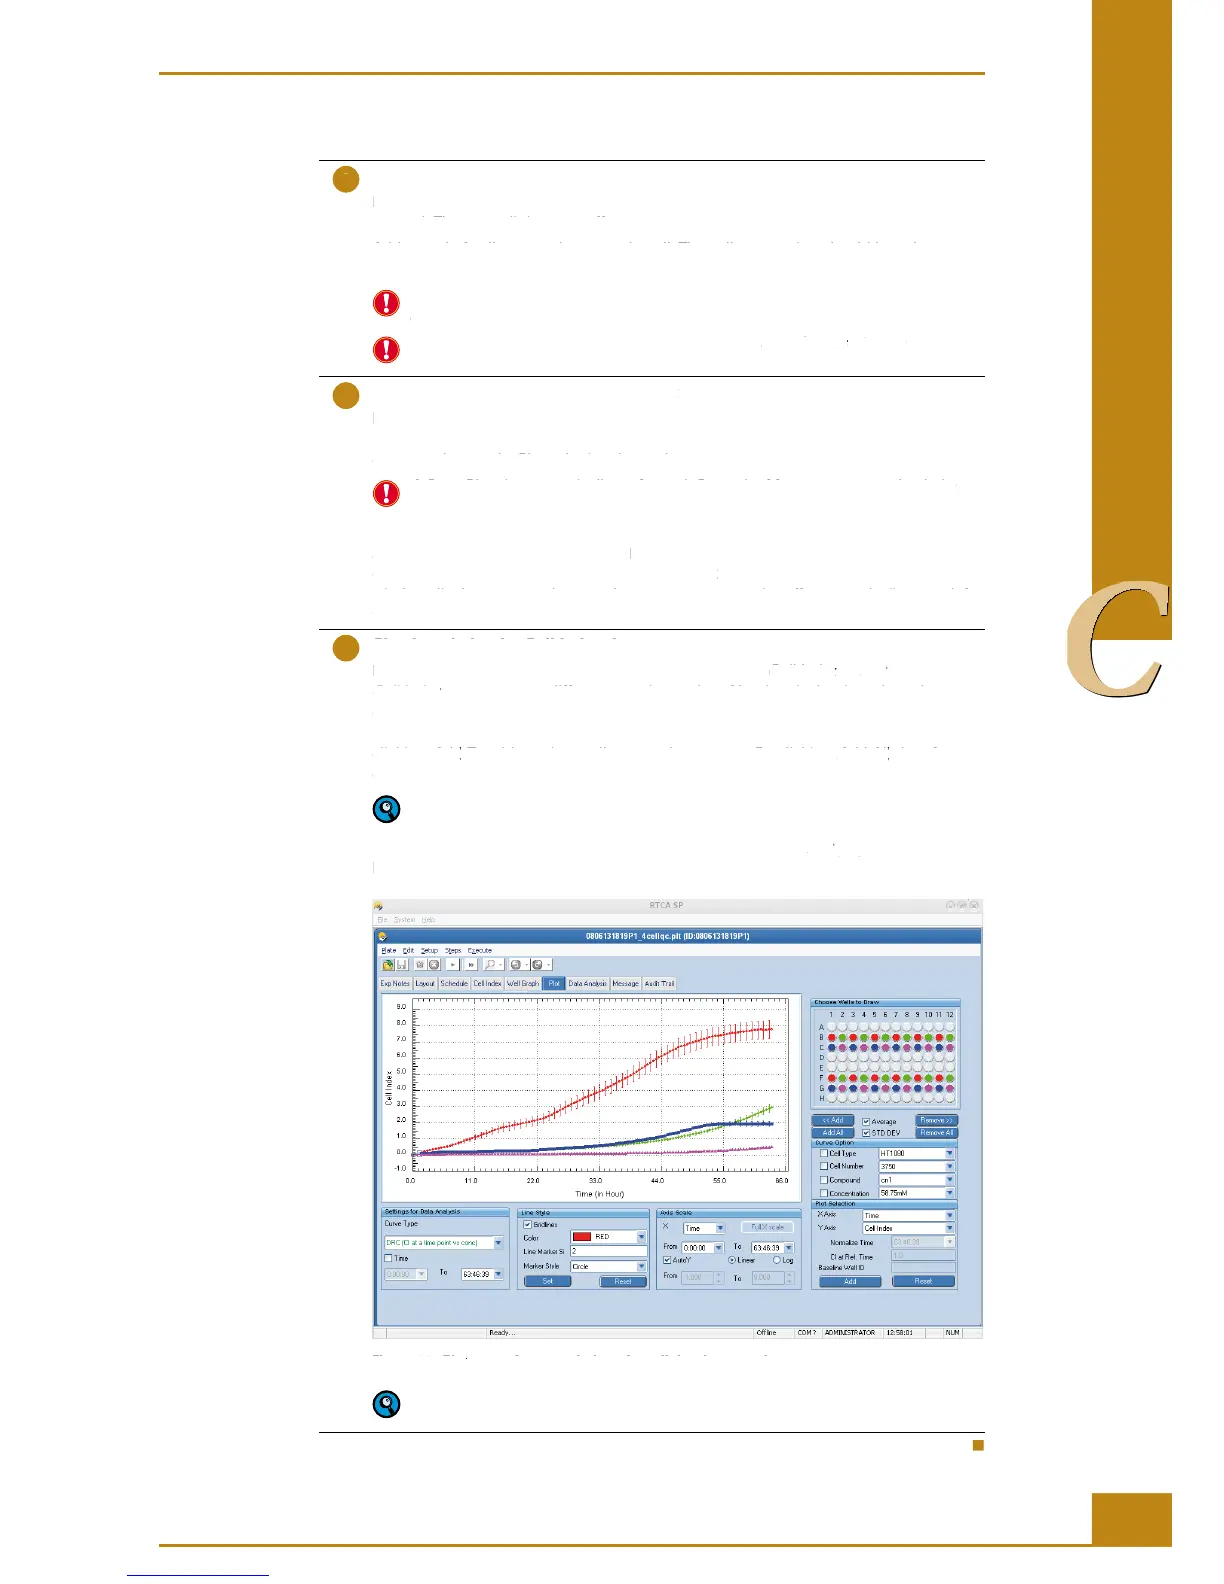
Typical results of a cell titration experiment generated on the Plot page are shown in
Figure 26.
Figure 26: Plot page after completion of a cell titration experiment.
Charts and data on the charts can be easily exported using a right-click of the
mouse.
Preparing and Starting a Run on the RTCA SP Instrument
Running a Quick Experiment
Remove the E-Plate 96 and add cells to the E-Plate 96 wells
Remove the E-Plate 96 from the RTCA SP Station by gently releasing the lock handle
upward. The green light turns off.
Add 100 µl of cell suspension to each well. The cell suspension should have been
properly prepared for the desired cell concentrations for the cell titration experiment.
Keep shaking for evenly distributed cell suspension so that each well has proper
Leave the E-Plate 96 in the tissue culture hood for
30 minutes at room 30 minutes
temperature, so that the cells settle at the bottom of the well.
Reinsert the E-Plate 96 and start step 2
Insert the E-Plate 96 as described above. Lock the E-Plate 96 to the cradle pocket by
turning the lock handle to the horizontal position. The green light turns on when it is
connected properly. Close the incubator door.
A Scan Plate is automatically performed. Go to the Message page to check the
Start step 2 by clicking the
button. During the experiment, note that the bottom
of the program window states
. The bottom-left of the program
window displays a countdown to the next sweep start time (for example, “0:10:30 left
Check and plot the Cell Index data
During the experiment and between sweeps, check the
page, move to different test time points (the time is the time since the start
Cell Index page, move to different test time points (the time is the time since the start Cell Index
of the experiment). Cell index values at the time point are shown in boxes. In the
page, plot the cell index for a well as a function of time, by highlighting the well, and
. To add another well, repeat the process. By clicking
Add. To add another well, repeat the process. By clicking Add
Add All, data for Add All
every well included in the experiment is shown.
For detailed information on how to plot and analyze experimental data please refer
to the RTCA Software Manual.
Typical results of a cell titration experiment generated on the
Plot page are shown in Plot
page after completion of a cell titration experiment.
Plot page after completion of a cell titration experiment.Plot
Charts and data on the charts can be easily exported using a right-click of the
Preparing and Starting a Run on the RTCA SP Instrument
Running a Quick Experiment